

- Sequence scoring works on amino acid sequences (FASTA or CSV). Use it to screen large numbers of candidates quickly.
- Structure scoring works on 3D structures (PDB files, or a ZIP of PDBs). Use it when the property depends on shape, surfaces, or contacts.
Only have a sequence? Run a structure prediction tool first (such as AlphaFold or Boltz-2), then score the predicted structure.
Quick to
Use the Scoring page
1. Open Protein Scoring
Sign in to app.tamarind.bio. On All Tools, click the Protein Scoring card (1). You can also search for “scoring”, or go directly to app.tamarind.bio/protein-scoring.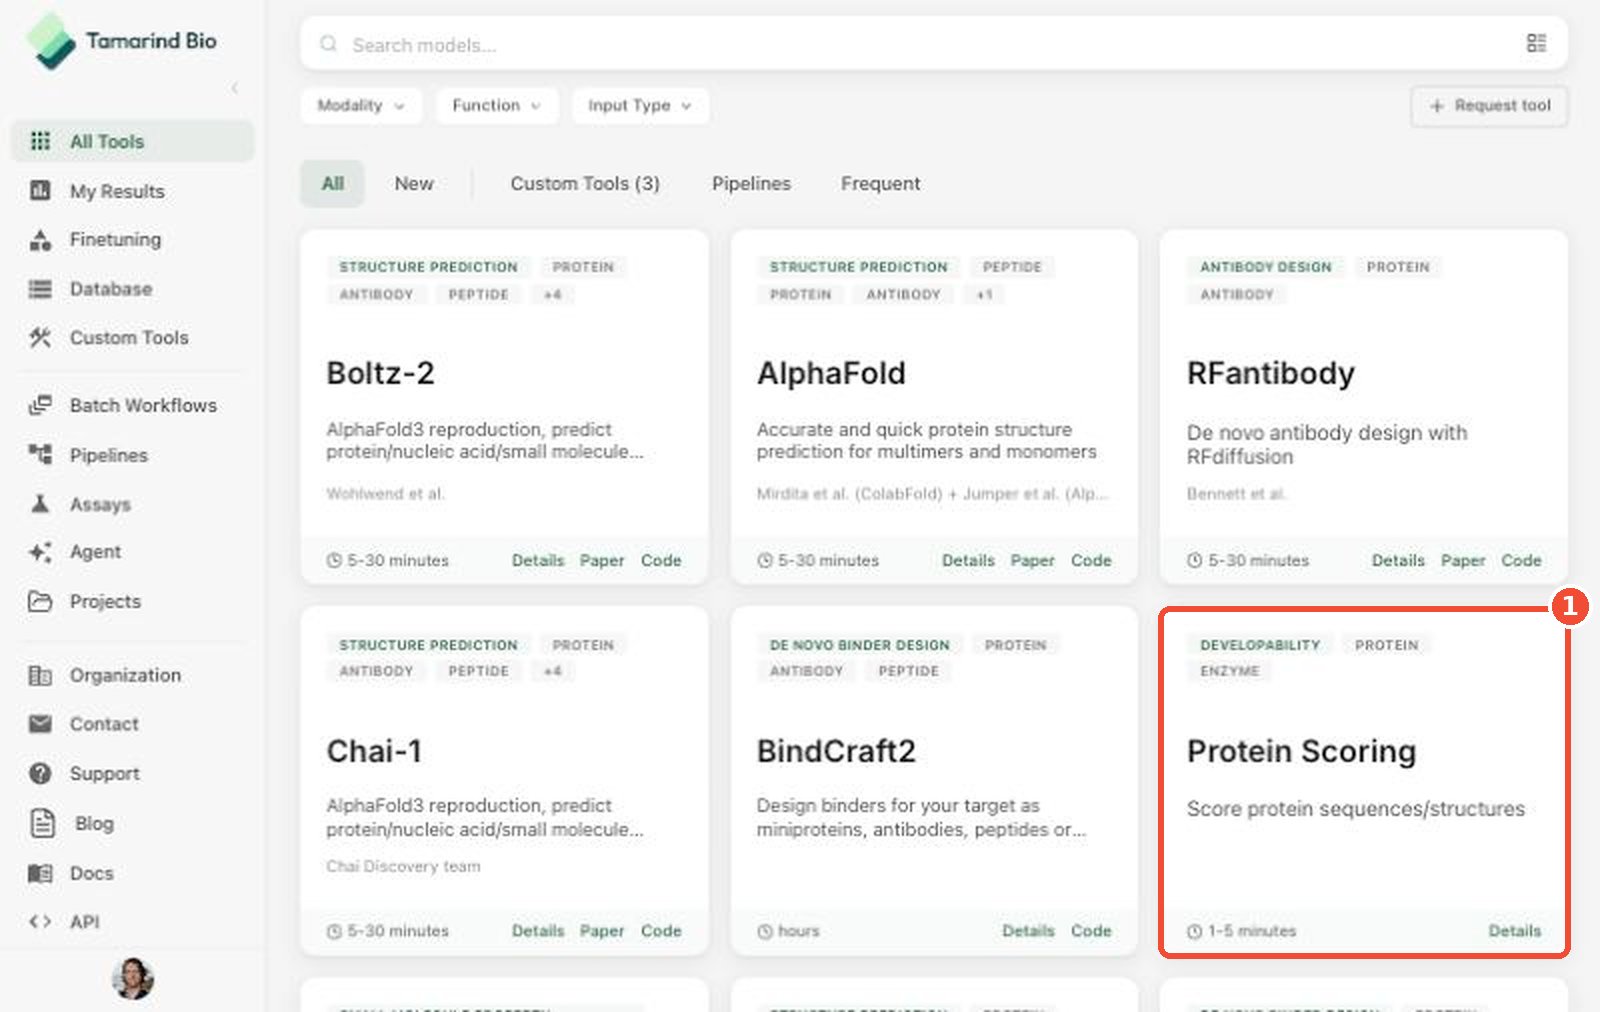
2. Get to know the page
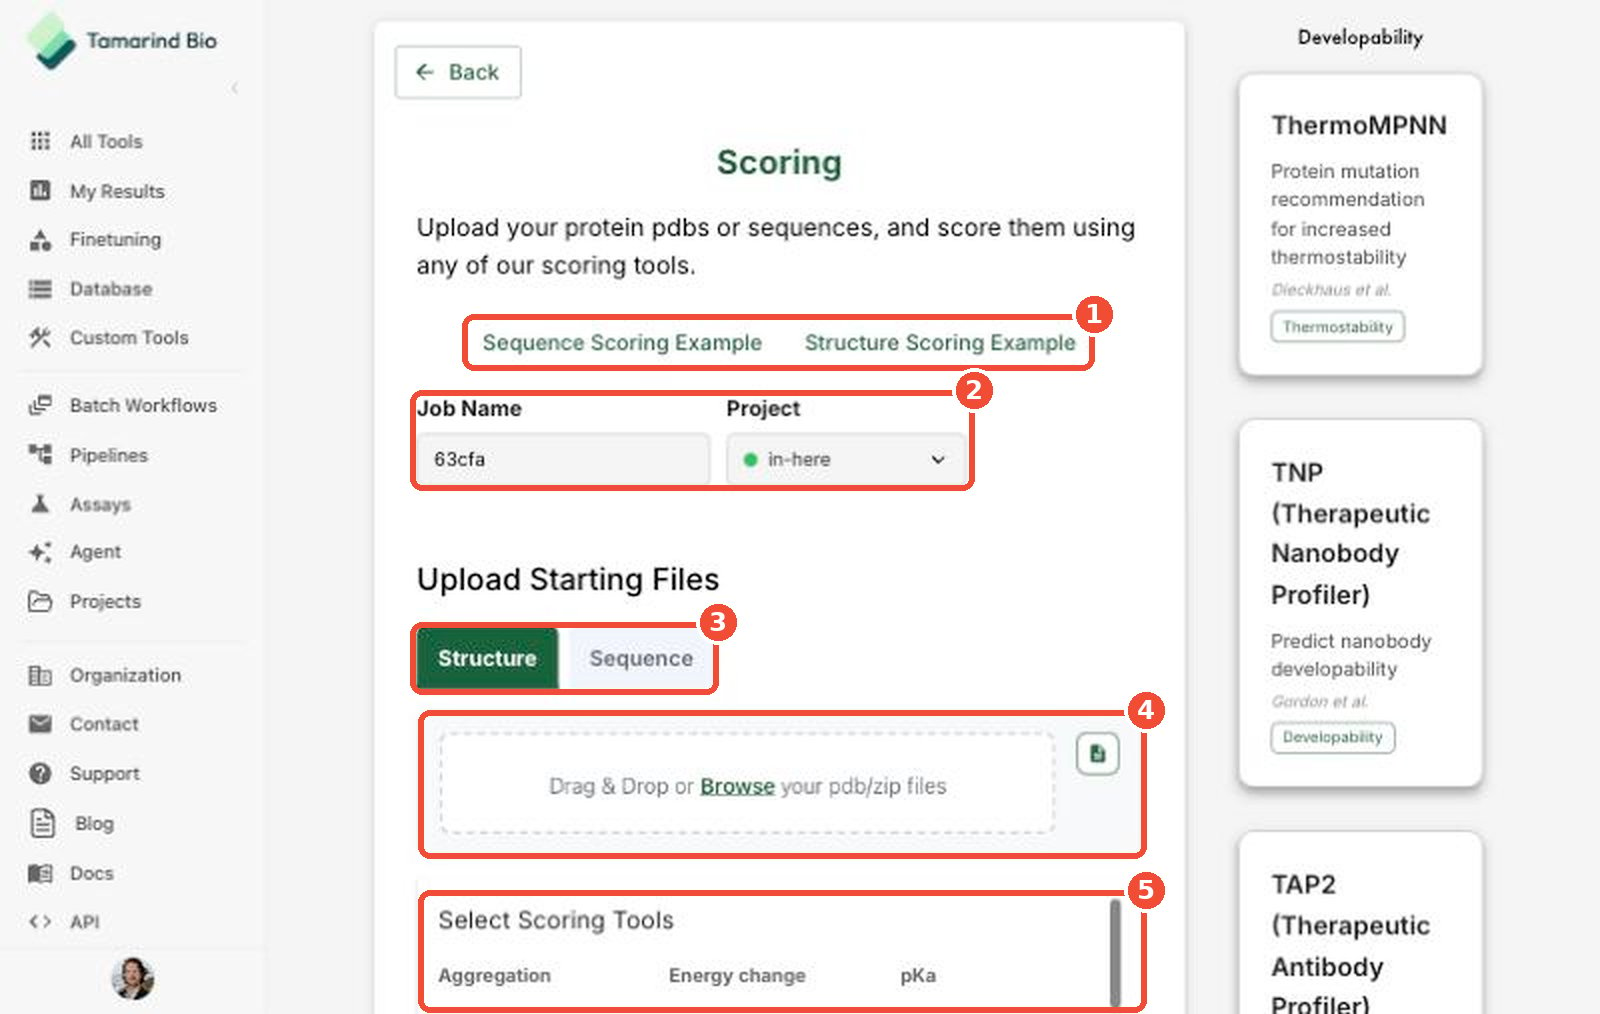
- Examples — Sequence Scoring Example and Structure Scoring Example fill in a sample file and tools so you can see how the page works.
- Job Name and Project — name the run and, optionally, add it to a project.
- Structure / Sequence — choose your input type. The list of scoring tools changes to match.
- Upload — drag and drop your files, or click Browse.
- Select Scoring Tools — check the tools you want, grouped by property.
3. Upload your inputs
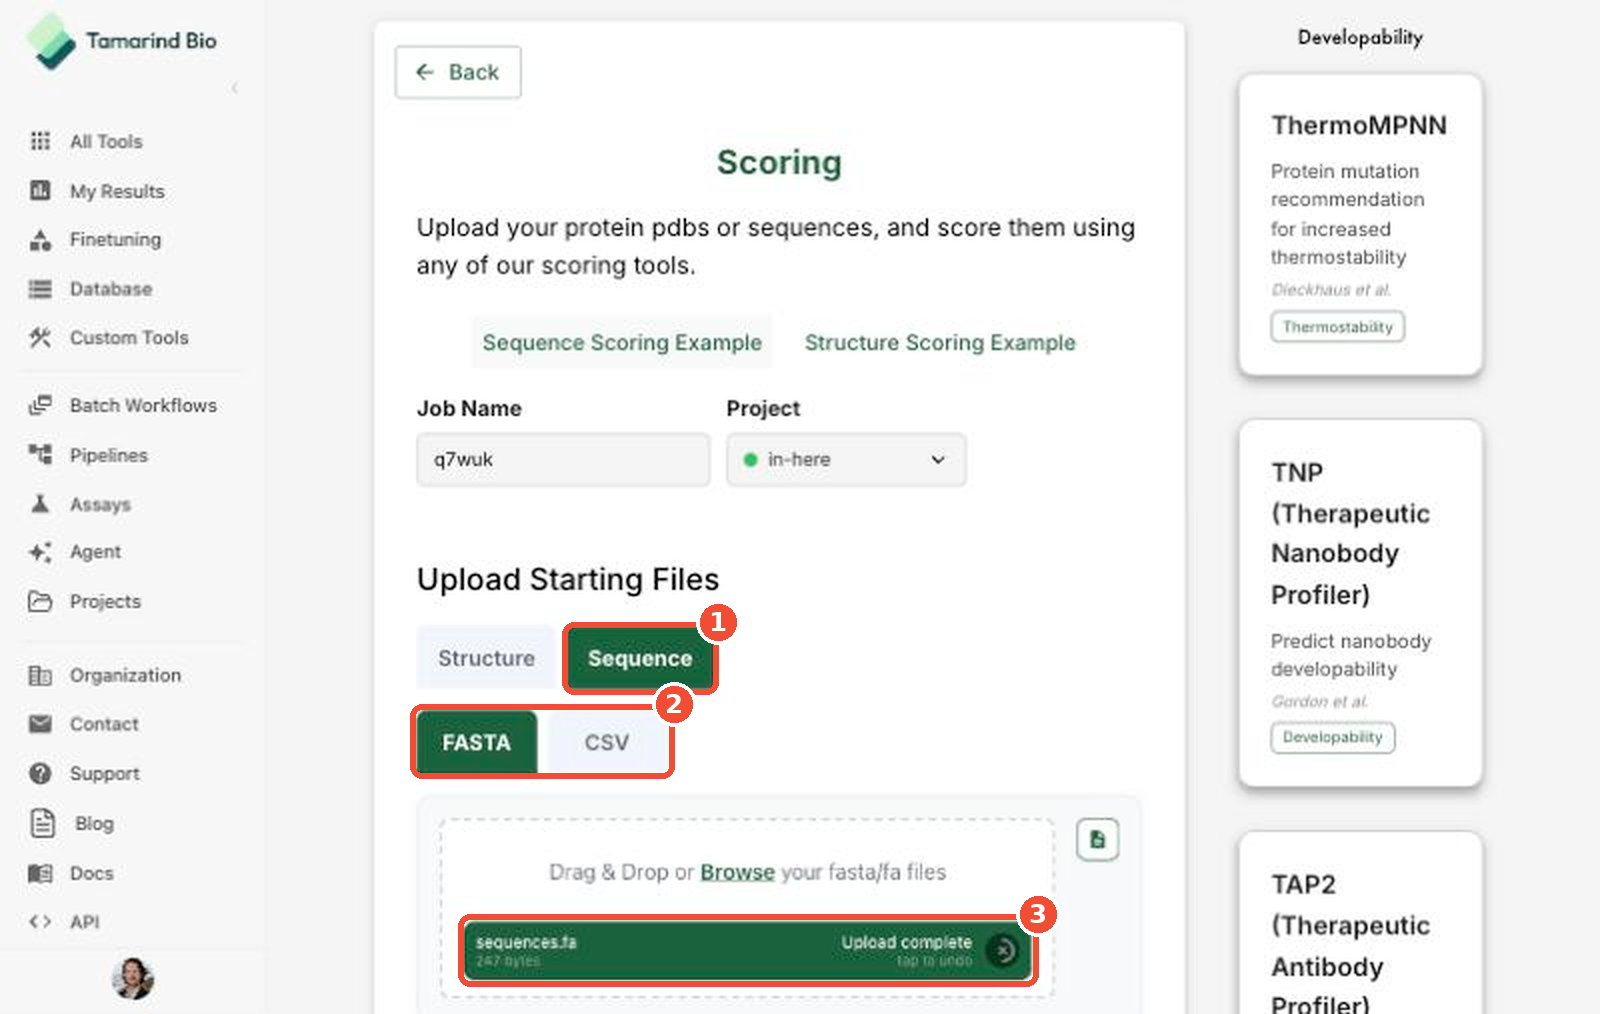
For sequences, click Sequence (1), then choose FASTA or CSV (2). Upload a.fasta or .fa file with one or more sequences. Your file appears once it’s uploaded (3).
.pdb files, or a .zip of PDB files. Click View to see the uploaded structure (see Structure scoring workflow).
4. Select scoring tools
Scroll the Select Scoring Tools list (1) and check each tool you want to run (2). Tools are grouped by the property they predict, so you can pick one tool per property or compare several tools for the same property.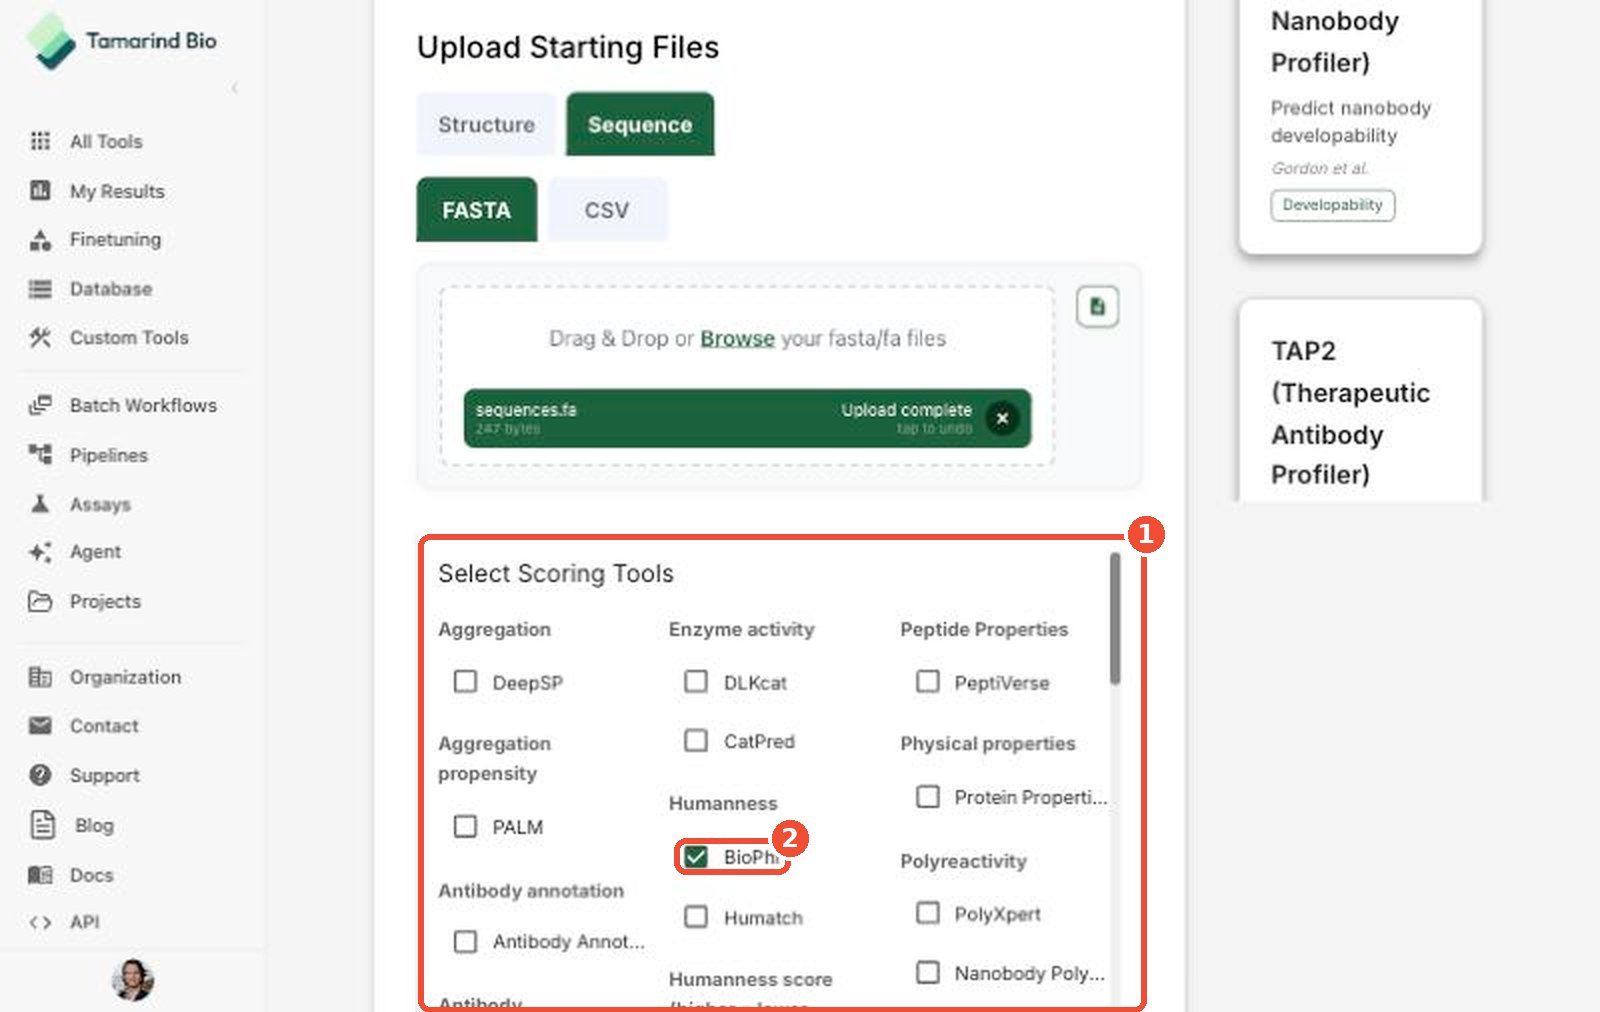
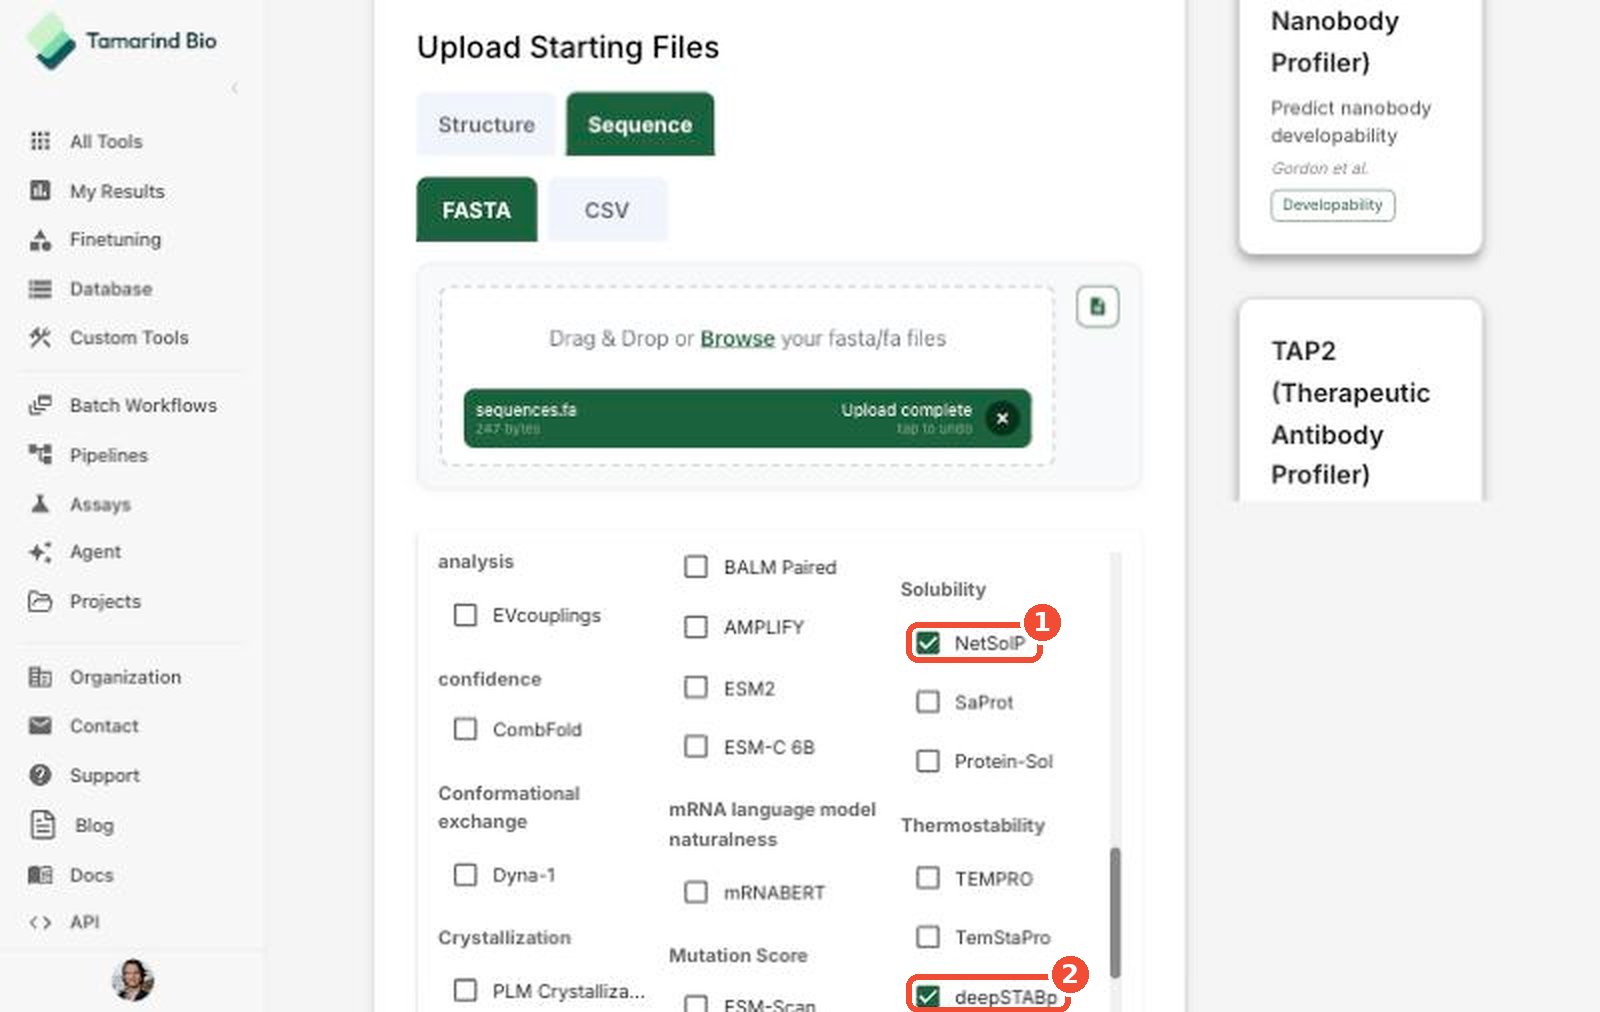
5. Review each tool’s settings
Each selected tool gets its own tab (1) below the list. For each tool:- Use Show Outputs, Show Settings, API Docs, and Details to learn what the tool returns and how it works.
- Review the tool’s settings. Your uploaded files are filled in automatically (Using uploaded inputs). Some tools have extra options, such as choosing antibody vs. nanobody or adding a light chain.
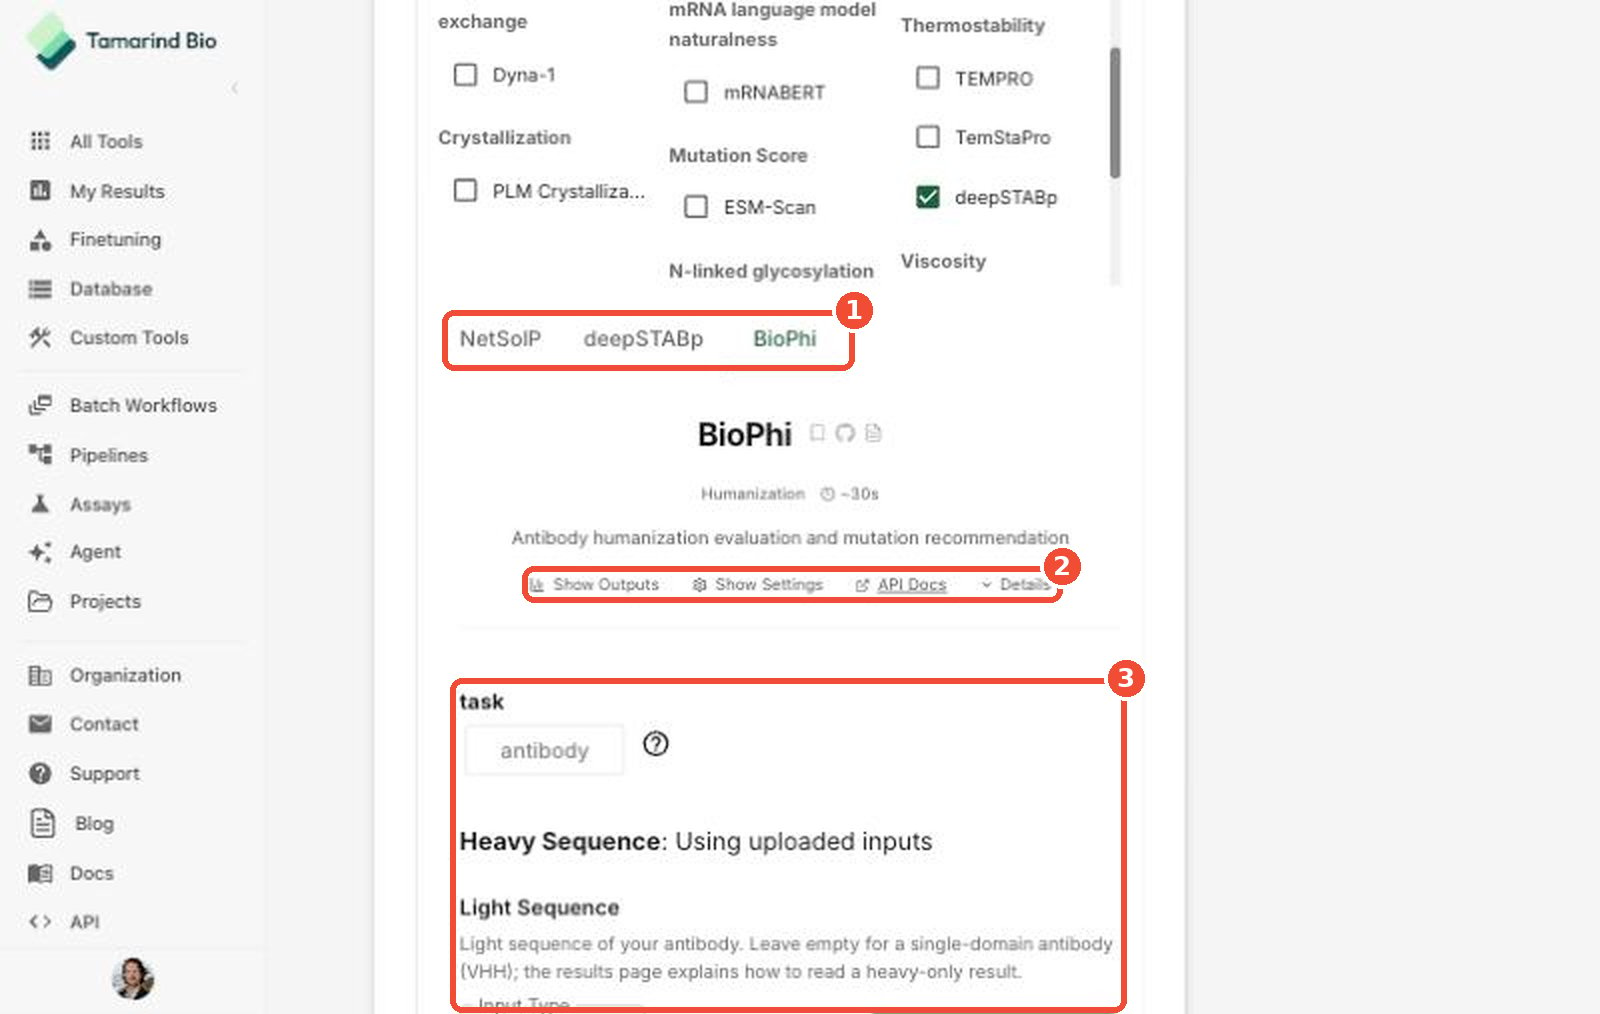
6. Submit
Before submitting, check Number of jobs and Estimated compute time (1). Each tool runs once per input, so 2 sequences × 3 tools = 6 jobs. Click Submit (2).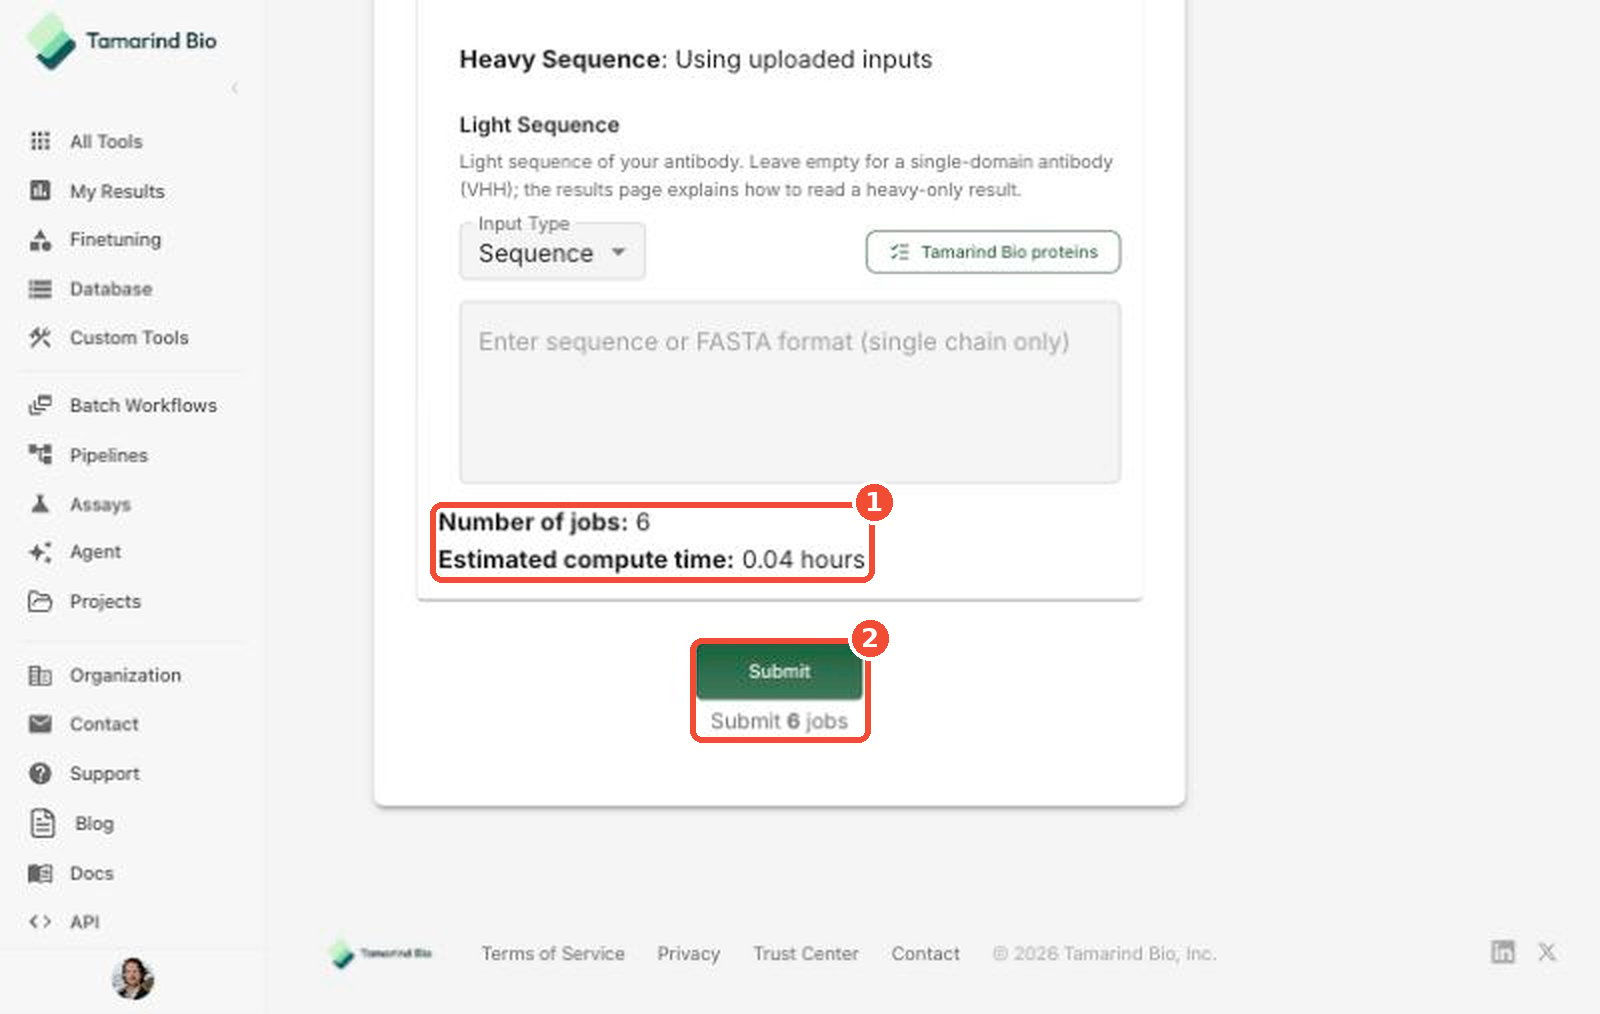
7. Get your results
Your jobs appear in My Results. When they finish, download the combined CSV, which has one row per protein and a column for each score.Sequence scoring
Sequence-based tools predict properties directly from the amino acid sequence, with no structure needed. They’re fast, which makes them good for filtering large libraries early.Sequence properties
Aggregation
What it is: The tendency of proteins to stick to each other and form clumps (aggregates), including amyloid fibrils. Aggregation is usually driven by short, sticky (hydrophobic) stretches of sequence and exposed hydrophobic or charged patches. Why it matters: Aggregates lower yield, shorten shelf life, and can trigger immune responses to therapeutics. Catching aggregation-prone sequences early saves expensive lab work. Tools: DeepSP (spatial aggregation propensity, SAP, and spatial charge map, SCM, for antibodies), PALM (aggregation propensity), CANYA (amyloid nucleation propensity).Antibody developability
What it is: How likely an antibody or nanobody is to be easy to manufacture, formulate, and use as a drug. Developability profilers compare your antibody with clinical-stage therapeutics on properties such as CDR length, surface hydrophobicity near the CDRs, and patches of positive or negative charge. The Therapeutic Antibody Profiler (TAP) flags antibodies whose values fall outside the range seen in approved and clinical-stage antibodies. Why it matters: Antibodies that look unusual on these metrics are more likely to have problems with stability, aggregation, or poor pharmacokinetics later on. Tools: TAP2 (antibodies), TNP — Therapeutic Nanobody Profiler (nanobodies). Related: DELPHI (polyreactivity and monomer purity, PSR pass probability), PolyXpert and Nanobody Polyreactivity, N-Linked Glycosylation Prediction.Binding affinity to small molecule
What it is: How strongly a protein binds a small molecule (ligand), usually reported as a dissociation constant (Kd), inhibition constant (Ki), or −log Kd (pKd). Higher pKd means tighter binding. Why it matters: Binding strength is a key measure of how well a drug engages its target. Tools: FlowDock (predicts the protein–ligand complex and its binding affinity from the protein sequence and ligand). For structure-based options, see Binding affinity to small molecule under Structure scoring.Humanness
What it is: How similar an antibody sequence is to antibodies found in the human immune repertoire. BioPhi scores humanness by comparing your sequence’s short peptides with millions of natural human antibody sequences (OASis), and can suggest mutations to make an antibody more human (Sapiens). Why it matters: Antibodies from animals (for example, mouse) can trigger an immune response in patients. More human-like sequences generally carry lower immunogenicity risk. Tools: BioPhi, Humatch, ImmunoSeq (humanness score; higher means lower immunogenicity risk).Immunogenicity
What it is: The likelihood that a protein triggers an unwanted immune response. A key step is when fragments of the protein (peptides) are presented on MHC/HLA molecules and recognized by T cells. Tools like NetMHCpan predict which peptides bind MHC molecules. Why it matters: Immune responses against a therapeutic can produce anti-drug antibodies (ADA) that reduce efficacy or cause side effects. Tools: NetMHCPan, DeepImmuno (MHC class I T-cell epitopes), TLimmuno (MHC class II), ImmuScope (MHC-II presentation and CD4+ T-cell epitopes), HLAIIPred (class II presentation), ImmunoSeq (antibody ADA risk from paired VH+VL).Isoelectric point
What it is: The isoelectric point (pI) is the pH at which a protein carries no net charge. IPC 2.0 predicts pI and the pKa values of individual ionizable groups from sequence. Why it matters: Proteins are least soluble near their pI. pI also affects purification (for example, ion-exchange chromatography), formulation buffer choice, and how a therapeutic is cleared from the body. Tools: IPC 2.0.Peptide properties
What it is: Physicochemical and drug-like properties of peptides, such as molecular weight, net charge, hydrophobicity, and solubility. PepFuNN is an open-source toolkit for in silico peptide analysis, including peptides with non-natural amino acids. Why it matters: These properties help you compare and prioritize peptide therapeutics and libraries before synthesis. Tools: PepFuNN Peptide Sequence Analysis, PeptiVerse (therapeutic peptide properties from sequence or SMILES). Related: Protein Properties (general physical properties).Protein protein interaction
What it is: Whether, and how strongly, two proteins bind each other. Sequence-based methods learn patterns linked to binding. Sequence comparison and motif analysis have long been used to predict protein–protein interactions, because proteins that resemble known binders are more likely to share their interactions (Mitrophanov & Borodovsky, 2006). Why it matters: Useful for screening binders, antibodies, and protein partners before modeling the complex. Tools: Spatial PPI v2. For structure-based options, see Protein protein interaction under Structure scoring.Solubility
What it is: How well a protein stays dissolved, often measured as soluble expression in a host such as E. coli. NetSolP uses protein language models to predict both solubility and usability (how likely a protein is to be expressed and purified). Why it matters: Insoluble proteins are hard to express, purify, and formulate at useful concentrations. Tools: NetSolP, SaProt, Protein-Sol.Thermostability
What it is: How well a protein keeps its folded structure as temperature rises, often reported as a melting temperature (Tm), or as a class (for example, thermophilic vs. mesophilic). TemStaPro predicts thermostability from protein language model embeddings. Why it matters: More stable proteins usually express better, last longer in storage, and tolerate harsher conditions in manufacturing and use. Tools: deepSTABp (melting temperature), TemStaPro, TEMPRO (nanobody melting temperature).Viscosity
What it is: How thick an antibody solution is at high concentration. DeepViscosity predicts whether a monoclonal antibody will be high or low viscosity at concentrations used for subcutaneous delivery. Why it matters: Subcutaneous injections need concentrated antibodies. Highly viscous solutions are hard to manufacture and inject. Tools: Deep Viscosity. Related: DeepSP (spatial charge map, which is linked to viscosity).All sequence scoring tools
Structure scoring
Structure-based tools use the 3D coordinates of your protein (and any bound partner or ligand). They can capture properties that depend on shape, surface, and atomic contacts, such as binding sites, surface charge, and interface energy.Structure properties
Aggregation
What it is: Aggregation propensity measured on the folded 3D structure. Aggrescan3D scores each residue’s intrinsic aggregation tendency, adjusted for how exposed it is on the surface, and highlights aggregation-prone surface patches. It can also suggest mutations that improve solubility. Why it matters: Unlike sequence-only methods, it focuses on residues that are actually exposed in the folded protein, where aggregation starts. Tools: Aggrescan3D.Binding affinity to small molecule
What it is: A prediction of how strongly a ligand binds its target protein, based on the 3D structure of the protein–ligand complex. Binding strength mostly comes from non-covalent interactions such as hydrogen bonds, hydrophobic contacts, and π-stacking. Scoring methods range from classical scoring functions (such as AutoDock Vina) to deep learning models. Wang & Huang (2025) describe AGIMA-Score, which represents the binding area as a graph of atoms, with edges for the interactions between protein and ligand atoms, and predicts binding strength (−log Kd/Ki). These methods are usually judged on two tasks:- Scoring — how well predicted binding strength matches measured values.
- Screening — how well the method separates true binders from non-binders (decoys) for a target.
Binding site
What it is: The pockets or residues on a protein where a ligand is likely to bind. AF2BIND uses AlphaFold2’s internal pair representation to predict which residues bind small molecules, without needing a ligand. Why it matters: Knowing where ligands bind is the first step in structure-based drug design, especially for new or poorly studied targets. Tools: AF2BIND. Related: FPocket (find pocket), Lacuna and fpocketR (druggability score).Electrostatic potential
What it is: The electric field around a protein, created by its charged and polar groups. PEP-Patch calculates the electrostatic potential on the protein surface and measures positive and negative surface patches. Why it matters: Surface charge affects protein–protein recognition, specificity, and antibody developability. For example, large positive patches are linked to faster clearance and higher viscosity. Tools: PEP-Patch.Energy change
What it is: How much the energy of a protein or complex changes, for example after a mutation (ΔΔG) or when two molecules bind. These tools use physics-based or learned energy functions to estimate stability and binding energy. Why it matters: Use it to rank mutations, compare designs, and find changes that stabilize a protein or improve binding. Tools: MM/GB(PB)SA (binding energy from molecular mechanics with implicit solvent), Rosetta Scoring, Binding ddG, SPURS (stability change for single and multiple mutations).Free energy
What it is: Rigorous, simulation-based estimates of binding free energy (ΔG). Relative binding free energy (RBFE) compares closely related ligands by gradually “transforming” one into another. Absolute binding free energy (ABFE) estimates the binding of a single ligand directly. These methods are usually more accurate than docking scores, but also more computationally expensive. Why it matters: Free energy calculations are often used in lead optimization to decide which compound to make next. Tools: Relative Binding Free Energy, Membrane Relative Binding Free Energy, Absolute Binding Free Energy, OpenFE, TMD. Related: OpenMM Metadynamics (free energy landscape).Language model metrics
What it is: Scores from protein language models and structure models that reflect how natural, confident, or well-designed a protein looks. COMPSS (Johnson et al.) combines metrics such as language model likelihood, inverse-folding scores, and structure confidence to predict which generated sequences are likely to be functional. Why it matters: These metrics help you filter computationally designed proteins before testing them in the lab. Tools: COMPSS Protein Metrics (choose Single Sequence Metrics or Structure Metrics).pKa
What it is: The pH at which an ionizable residue (such as Asp, Glu, His, Lys, or Cys) is half protonated. The local environment in a folded protein can shift pKa values far from their values in solution. PROPKA predicts these values from a 3D structure. Why it matters: Protonation states affect catalysis, binding, stability, and how you set up simulations and docking. Tools: PROPKA. For sequence-based pI and pKa, see Isoelectric point.Solubility
What it is: Solubility predicted using structural information. SaProt is a protein language model that uses both sequence and structure tokens, which can improve property predictions over sequence alone. Why it matters: Same as sequence solubility: soluble proteins are easier to express, purify, and formulate. Tools: SaProt.Surface interactions
What it is: Patterns on a protein’s molecular surface (shape, charge, and hydrophobicity) that predict where and how it interacts with other molecules. MaSIF uses geometric deep learning to learn “interaction fingerprints” from surface patches and predict interaction sites. Why it matters: Helps identify likely binding interfaces and compare surfaces between proteins. Tools: MaSIF, SurfDock (surface-informed docking with a screening confidence score).More structure scoring tools
New tools are added regularly. The Scoring page always shows the current list.
Example sequence scoring workflow
Goal: Screen a set of antibody candidates for humanness, solubility, and thermostability before choosing which to make.- Open Protein Scoring and click Sequence Scoring Example to load a sample, or click Sequence and upload your own FASTA file (one sequence per antibody chain or construct).
- Under Select Scoring Tools, check:
- BioPhi (Humanness)
- NetSolP (Solubility)
- deepSTABp (Thermostability)
- In the BioPhi tab, keep the task as antibody. Leave Light Sequence empty for nanobodies (VHH), or add a light chain if you’re scoring paired antibodies.
- Check Number of jobs and Estimated compute time. In the example, 3 tools × 2 sequences = 6 jobs.
- Click Submit.
- When the jobs finish, open the combined CSV from My Results and sort by each score. Shortlist candidates that are human-like, predicted soluble, and have a high predicted melting temperature.
- Next step: predict structures for your shortlist, then run structure scoring on them (below).
Example structure scoring workflow
Goal: Score a structure with language model metrics and, for a complex, predict the binding affinity at its interface.-
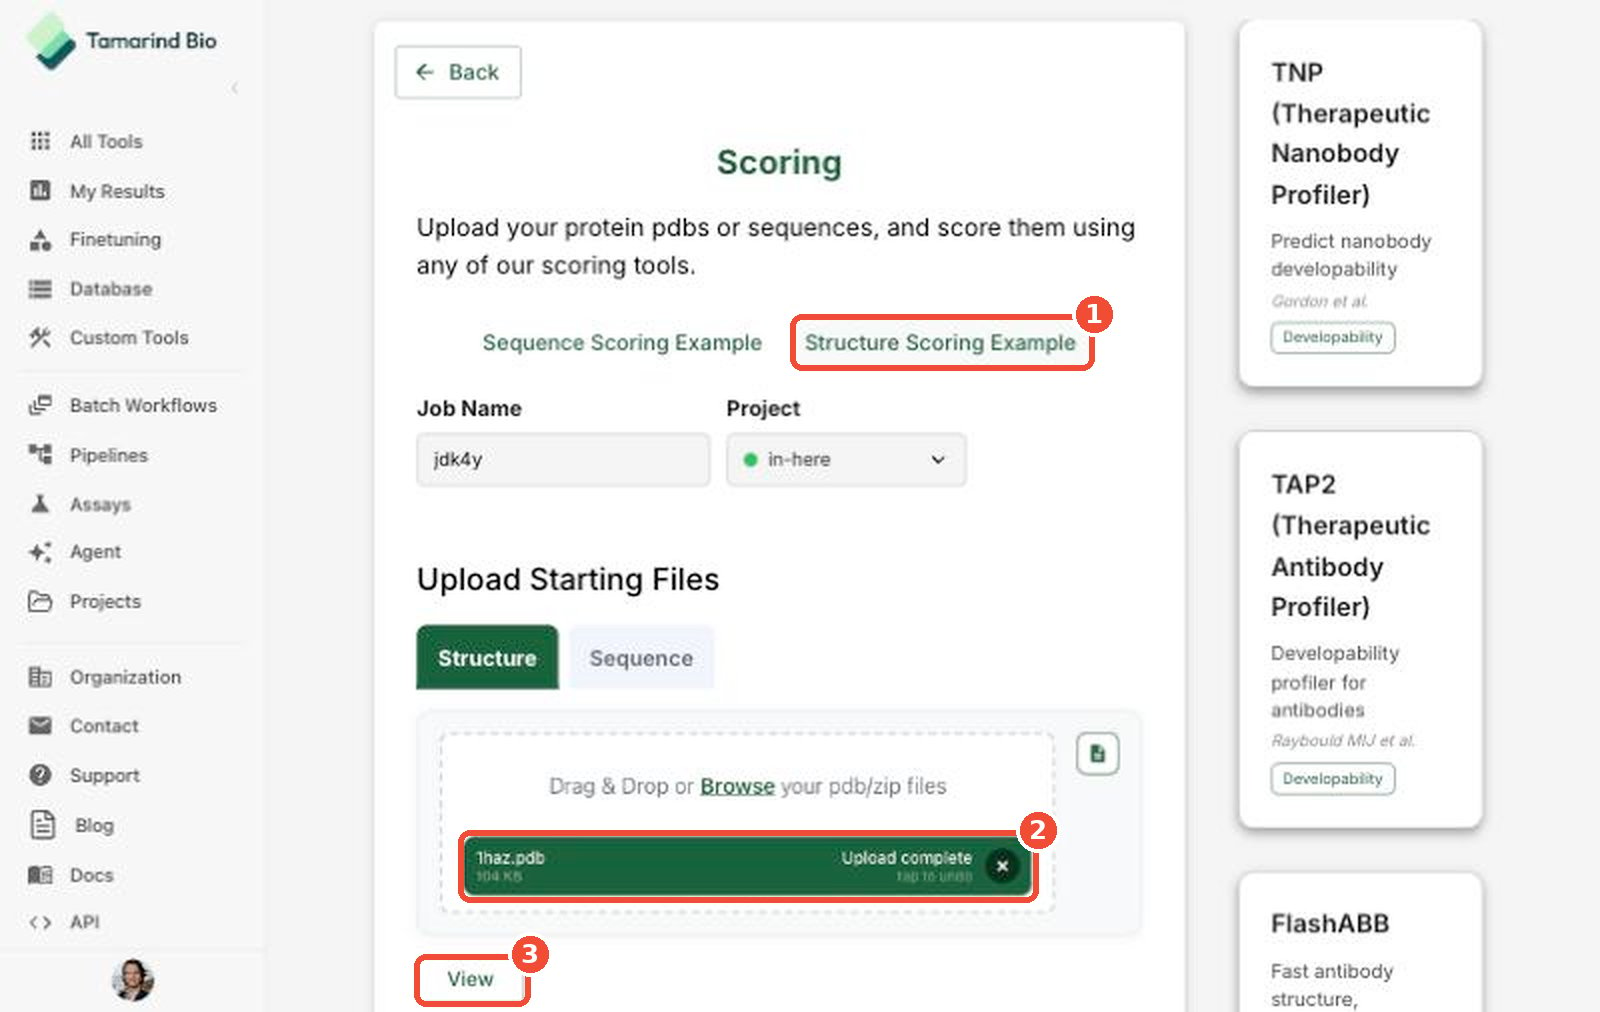
Open Protein Scoring and click Structure Scoring Example (1) to load
1haz.pdb(2), or click Structure and upload your own PDB files (or a ZIP). -
Click View (3) to check that the structure looks right.
-
Under Select Scoring Tools, check:
- COMPSS Protein Metrics (Language model metrics)
- PRODIGY (Protein protein interaction — predicted binding affinity from interface contacts; needs a structure with two or more chains)
- In the COMPSS Protein Metrics tab (1), choose Structure Metrics (2) to score the structure (or Single Sequence Metrics to score sequence only).
-
Check Number of jobs and Estimated compute time (3). In the example, 2 tools × 1 structure = 2 jobs.
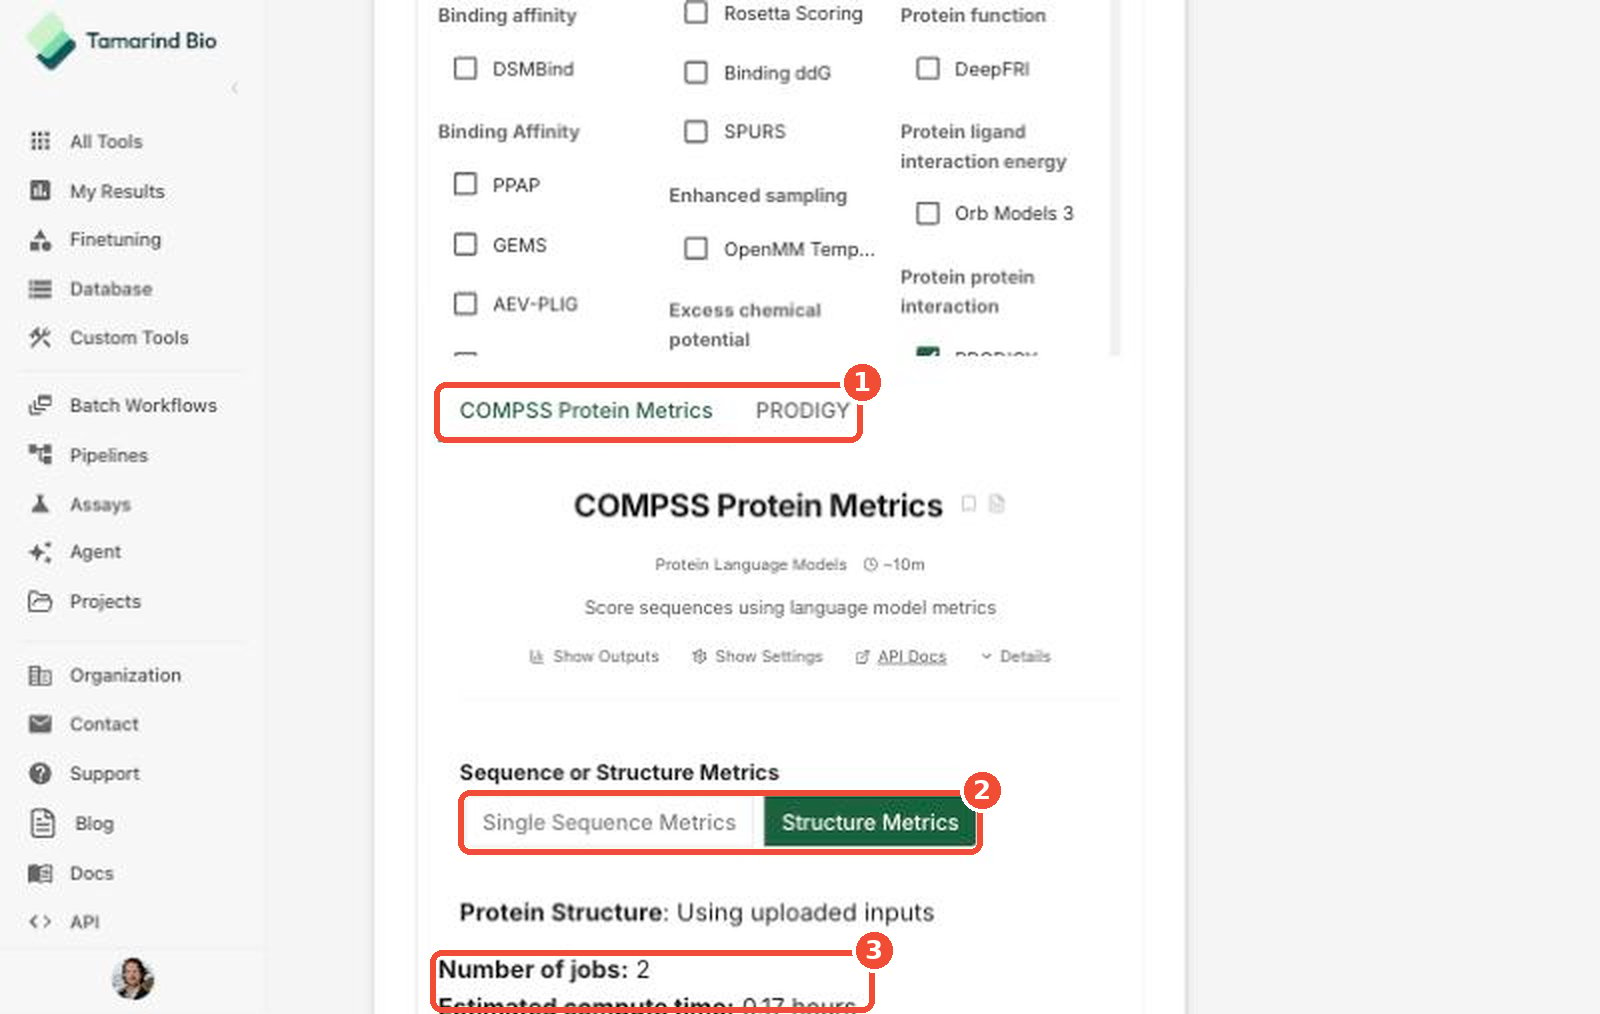
- Click Submit, then download the combined CSV from My Results when the jobs finish.
Interpreting scores
- Compare like with like. Each tool has its own scale and meaning, and higher isn’t always better. Check each tool’s Show Outputs and Details before ranking.
- Use a reference. A score is most useful compared with a baseline, such as known good proteins or a starting design. In sequence analysis, a score’s statistical significance (for example, a P-value: the chance of seeing that score or a higher one by chance) is what tells you whether it’s meaningful, not the raw value alone (Mitrophanov & Borodovsky, 2006).
- Combine evidence. Scores are predictions. Use several properties together to prioritize candidates, then confirm the most important ones experimentally.
Learn more
- Scoring page in the app
- Compute Hours
- API — run scoring tools programmatically
- Manage Files
References
- Mitrophanov AY, Borodovsky M. Statistical significance in biological sequence analysis. Briefings in Bioinformatics. 2006;7(1):2–24.
- Wang DD, Huang Y. Scoring protein-ligand binding structures through learning atomic graphs with inter-molecular adjacency. PLoS Comput Biol. 2025;21(5):e1013074.
- Raybould MIJ et al. Five computational developability guidelines for therapeutic antibody profiling (TAP).
- Prihoda D et al. BioPhi: A platform for antibody design, humanization and humanness evaluation.
- Thumuluri V et al. NetSolP: predicting protein solubility in E. coli using language models.
- Pudžiuvelytė I et al. TemStaPro: protein thermostability prediction using sequence representations from protein language models.
- Kozlowski LP. IPC 2.0: prediction of isoelectric point and pKa dissociation constants.
- Ochoa R et al. PepFuNN: Novo Nordisk open-source toolkit to enable peptide in silico analysis.
- Reynisson B et al. NetMHCpan-4.1.
- Kalejaye L et al. DeepViscosity.
- A3D database: structure-based predictions of protein aggregation for the human proteome (Aggrescan3D).
- Gainza P et al. Deciphering interaction fingerprints from protein molecular surfaces using geometric deep learning (MaSIF).
- Gazizov A et al. AF2BIND: Predicting ligand-binding sites using the pair representation of AlphaFold2.
- Hoerschinger VJ et al. PEP-Patch: Electrostatics in protein–protein recognition, specificity, and antibody developability.
- Johnson SR et al. Computational scoring and experimental evaluation of enzymes generated by neural networks (COMPSS).
- PROPKA (Jensen group).