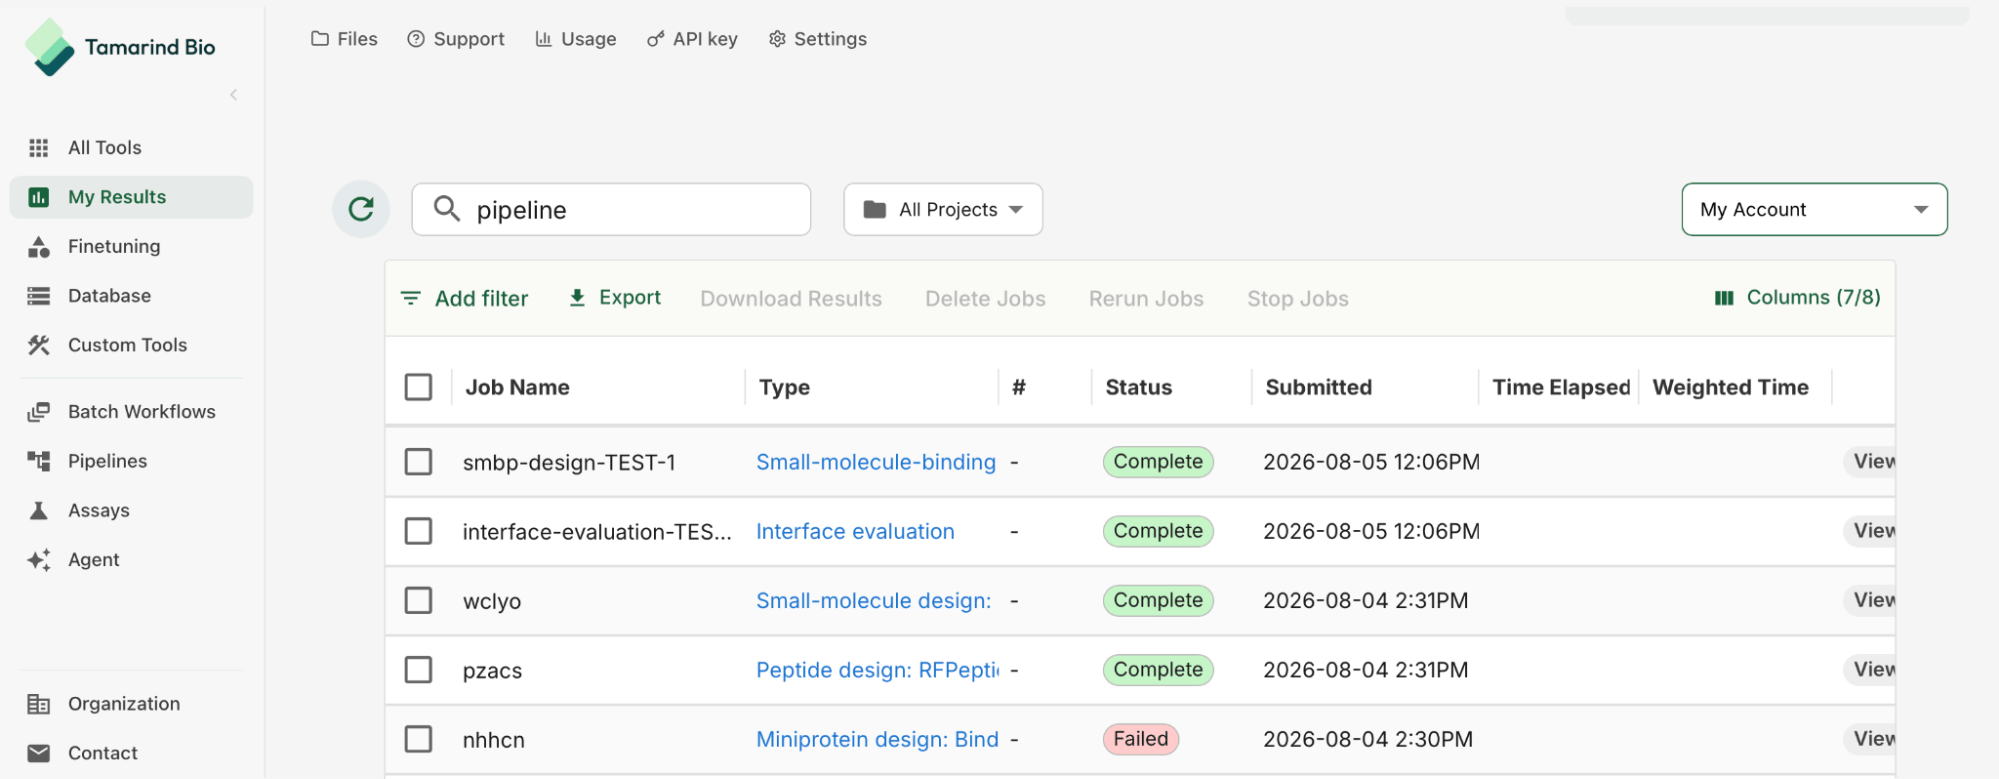
Getting started
Pipelines live in their own tab in the sidebar, and every pipeline you’ve published to your organization also appears alongside the built-in tools on the All Tools page. The Pipelines dashboard is the jumping-off point for creating a new template, opening a starter, or reviewing test and published runs.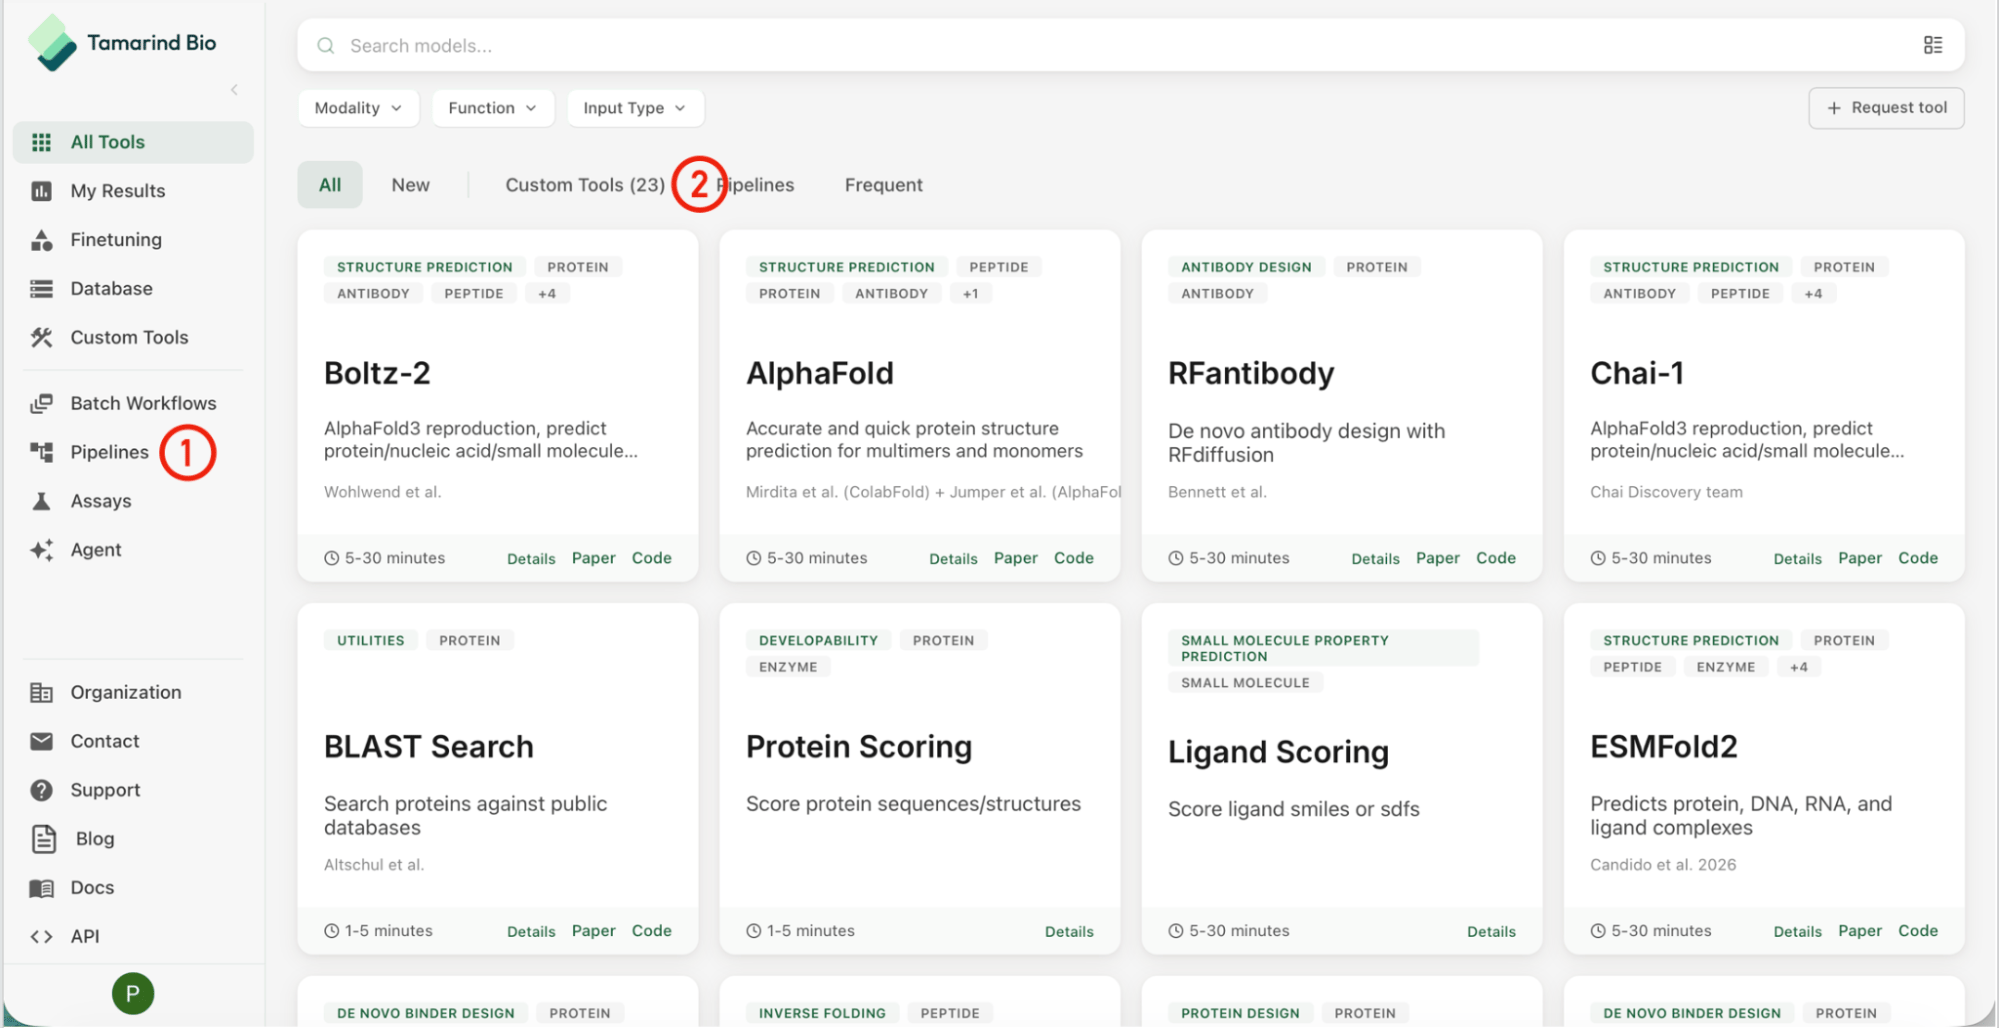
- Build and access your pipelines from the Pipelines tab
- Or just see your published pipelines in card format from the Tools page
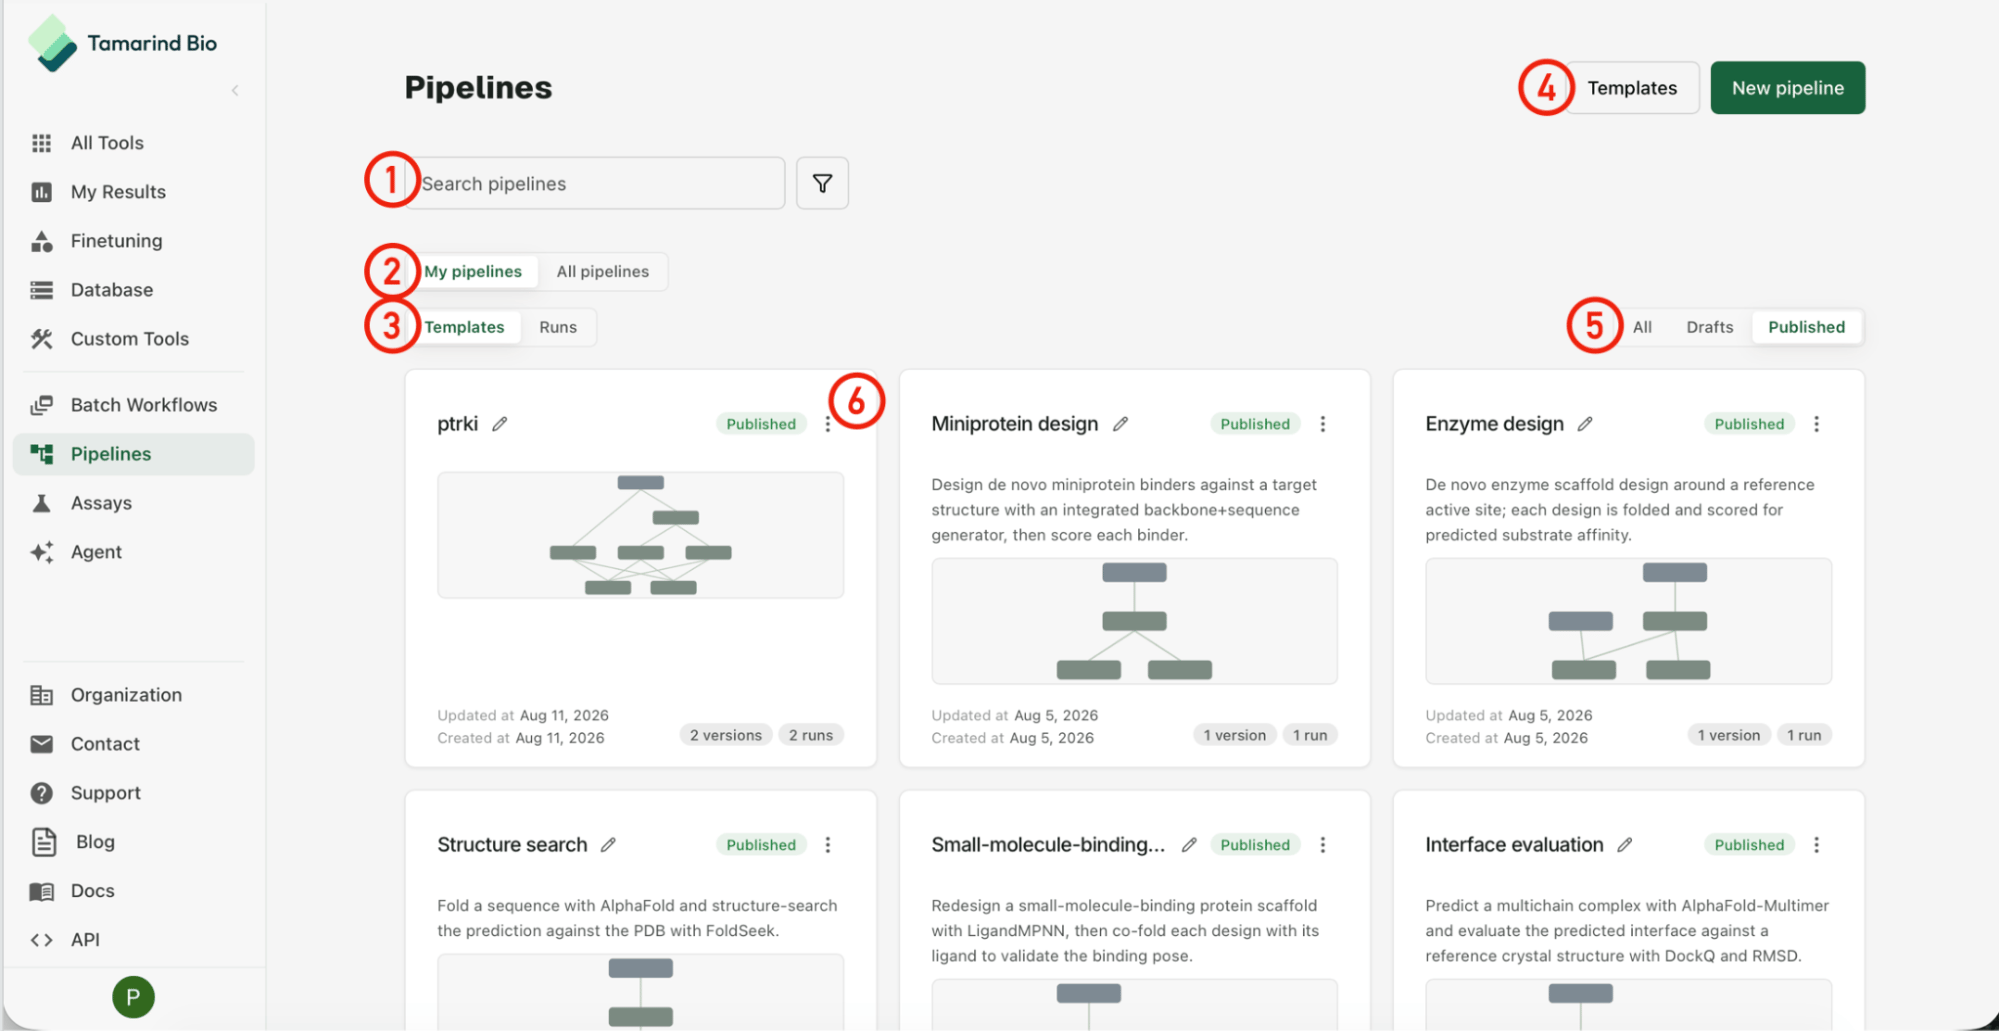
- Search your pipelines
- Filter between your pipelines and those created by others in your organization
- View your pipeline templates or the test/real runs
- Start from a starter template for the most used workflows or build your own
- View draft or published pipelines
- Additional options on template card menu
Building a pipeline
A pipeline is a graph of nodes on a canvas: input nodes at the top feed molecules into tool nodes, which pass their outputs downstream to other tools. You can drag tools in from the sidebar, connect ports by hand, or ask the pipelines agent to build a first draft that you refine from there.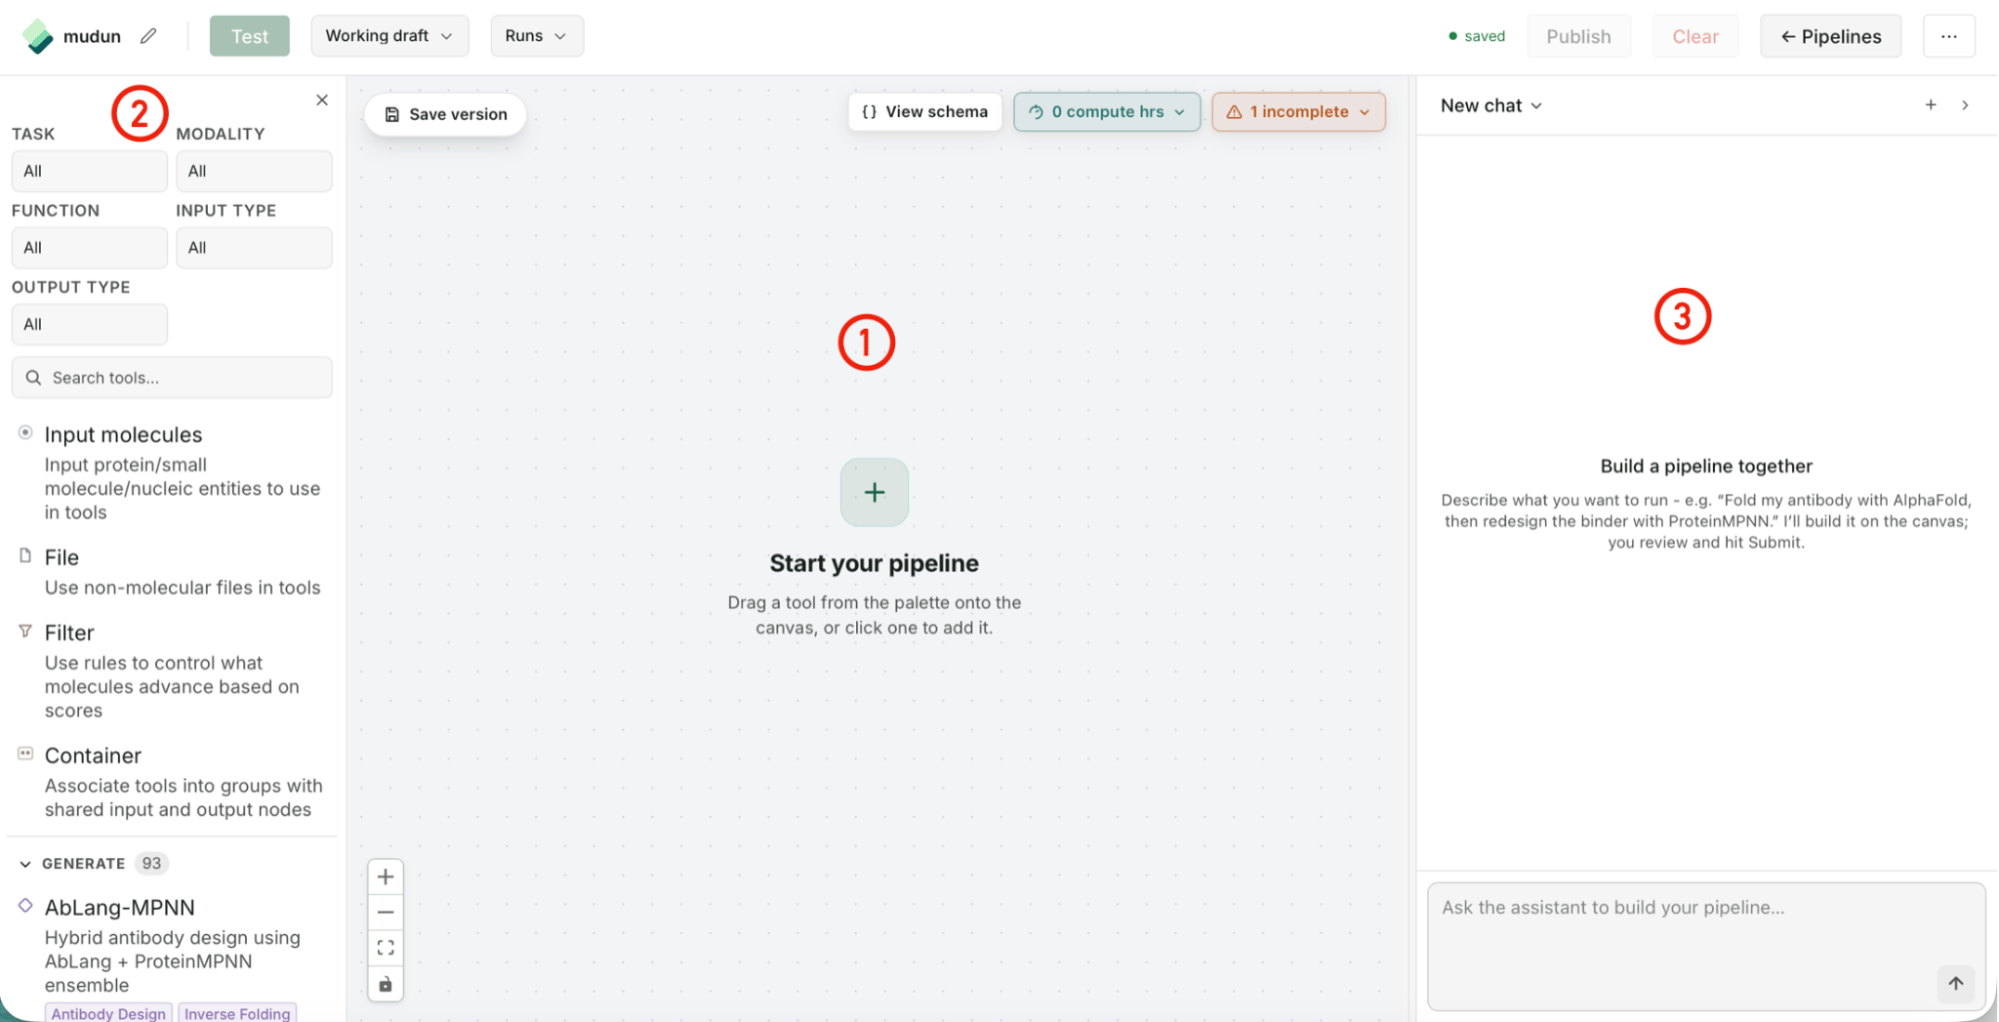
- Your pipeline gets built on the canvas
- You can either search/drag your tool nodes
- Or ask the pipelines agent to build your pipeline for you
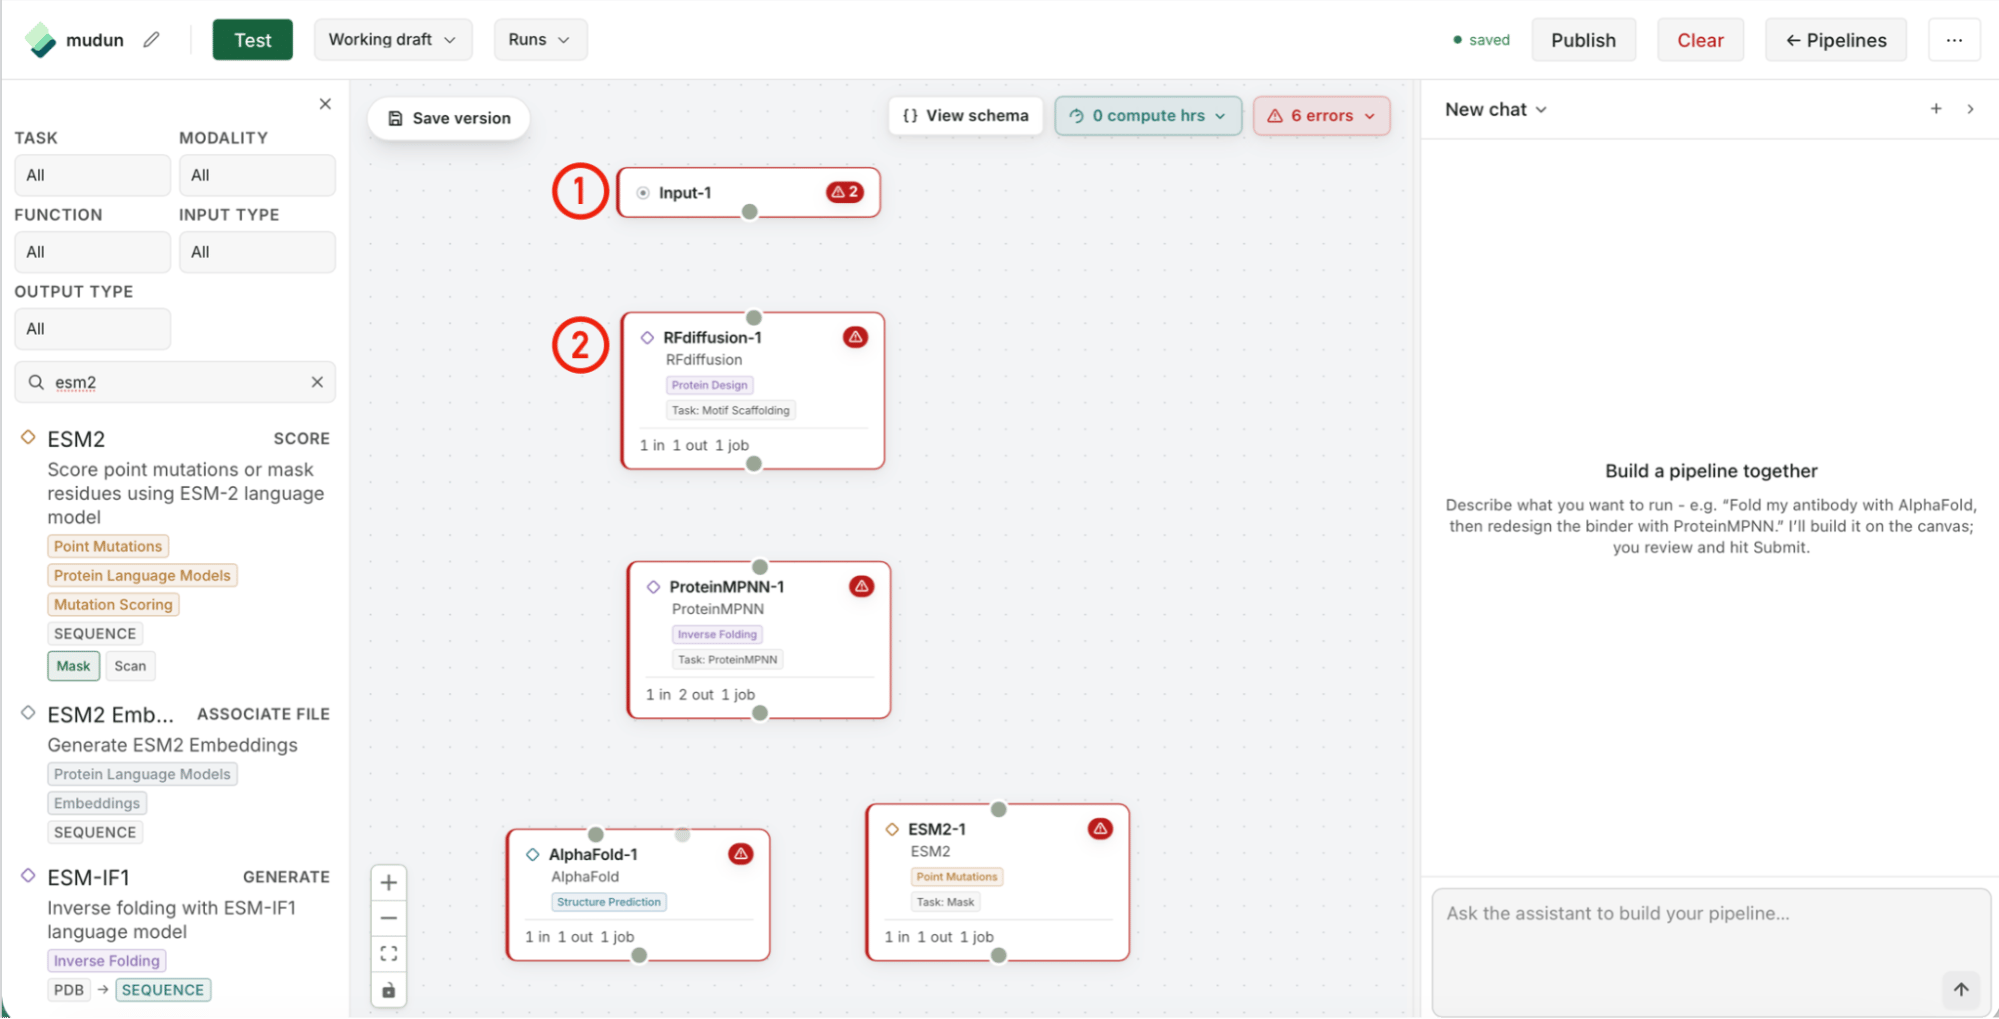
- Pipelines start with input node(s). These must be populated with a default molecule (protein, small molecule, or nucleic acid) for testing, but when you submit the pipeline you’ll be able to give other inputs
- You will then have individual tool nodes that need to be connected together
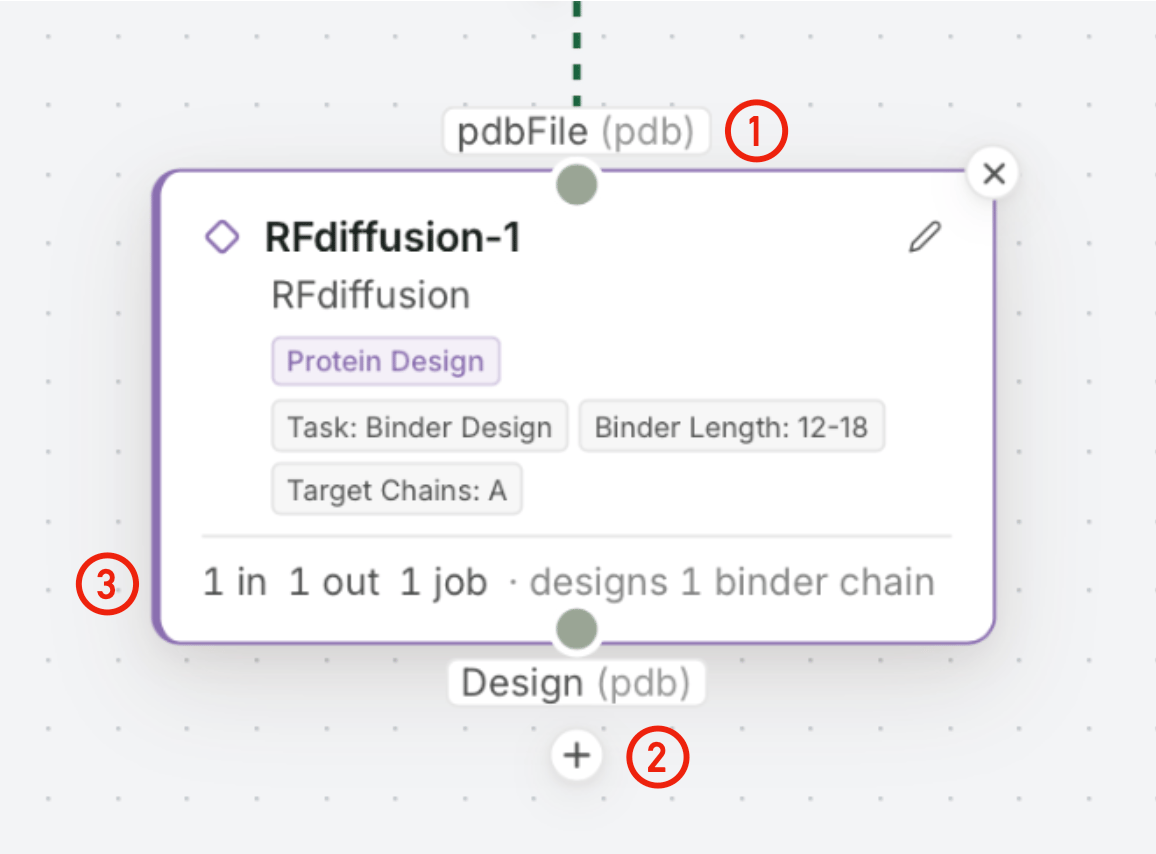
- You can see the input type
- And output type. Note that most tools produce multiple output types. Clicking on the tool and going to the Info tab will show you information about the tool’s purpose/input and output specs. You can also add connected nodes using the (+) menu.
- The bottom bar shows, based on your settings, how many input molecules are intaken/output molecules are generated and how these are batched into jobs
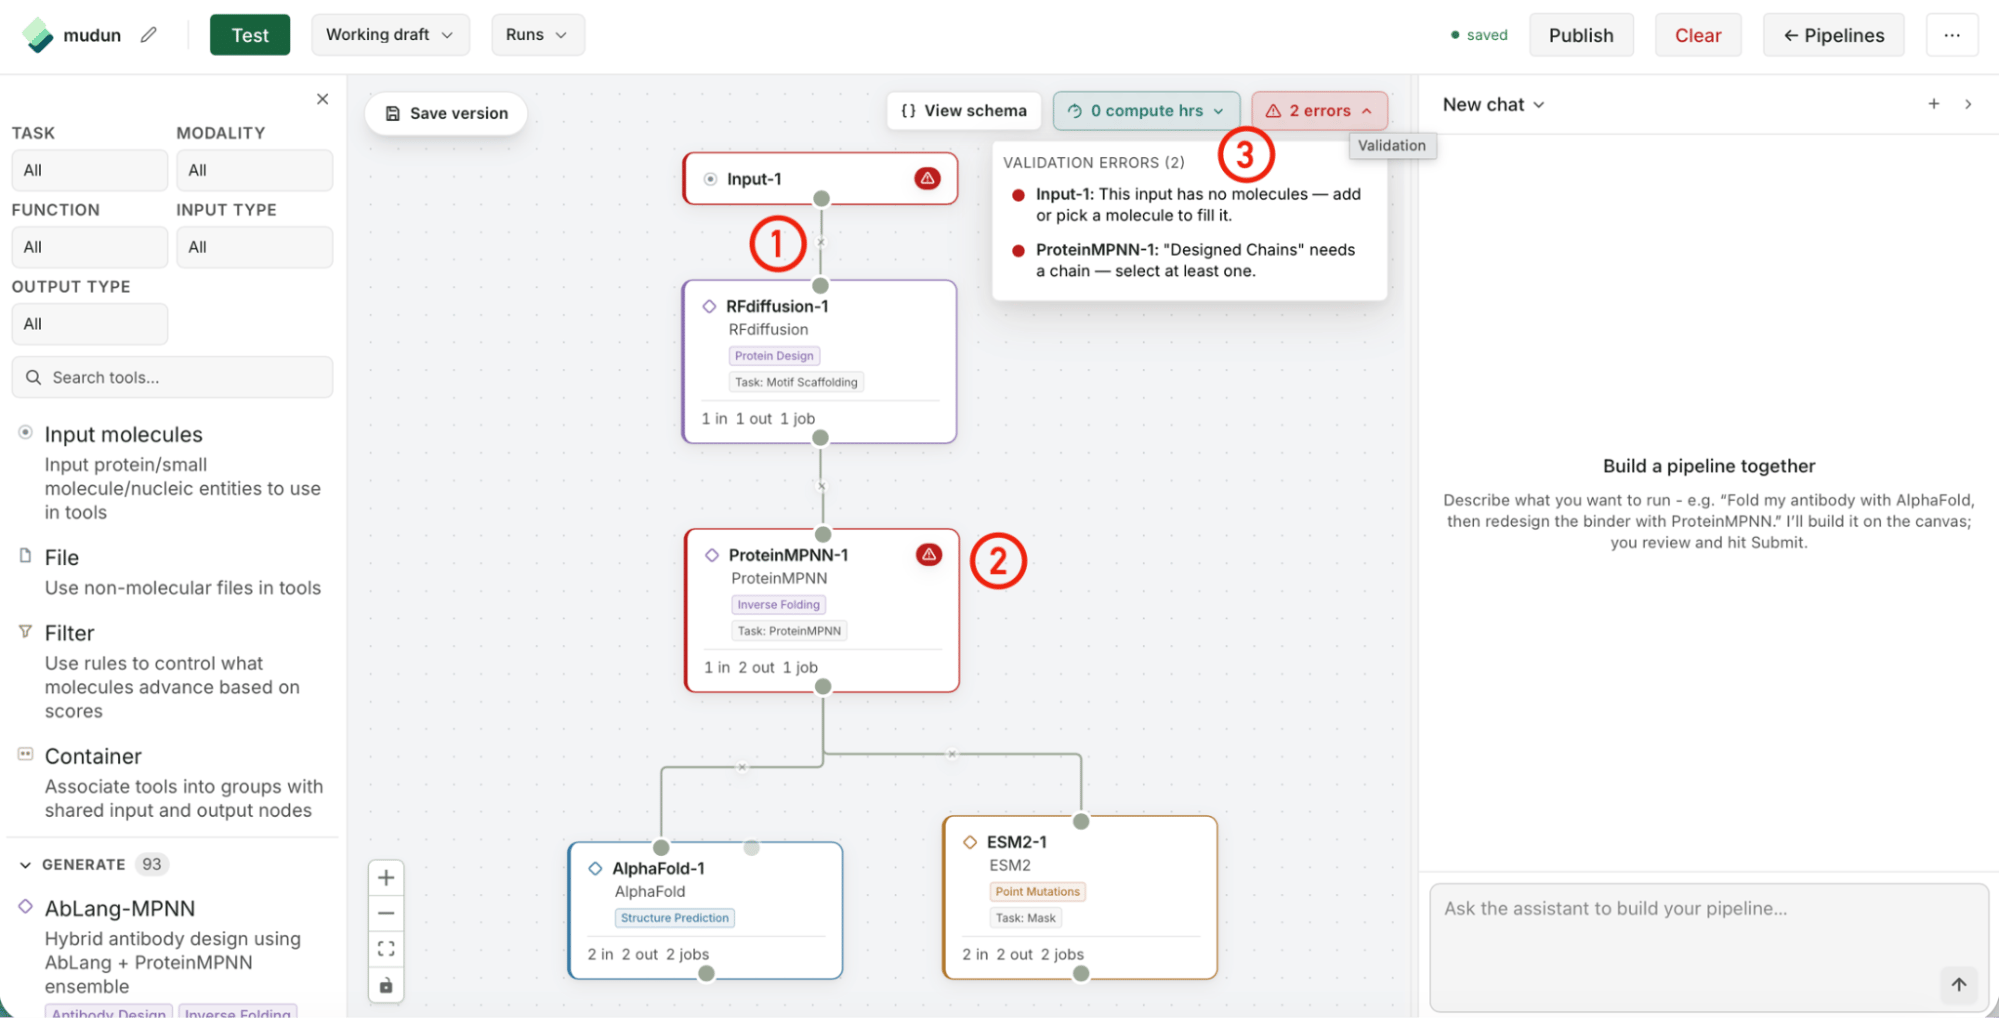
- Connect nodes together by dragging between inputs and outputs
- See if settings modifications need to be made per node to validate the pipeline
- Or look at all the detected errors in the top right corner
Specifying settings
Every node has its own settings dialog with two audiences. Behind-the-scenes settings are the values you lock in as the author, and editable settings are the ones you expose to whoever runs the pipeline later. Some tools also need you to pick specific chains from an upstream molecule to feed forward.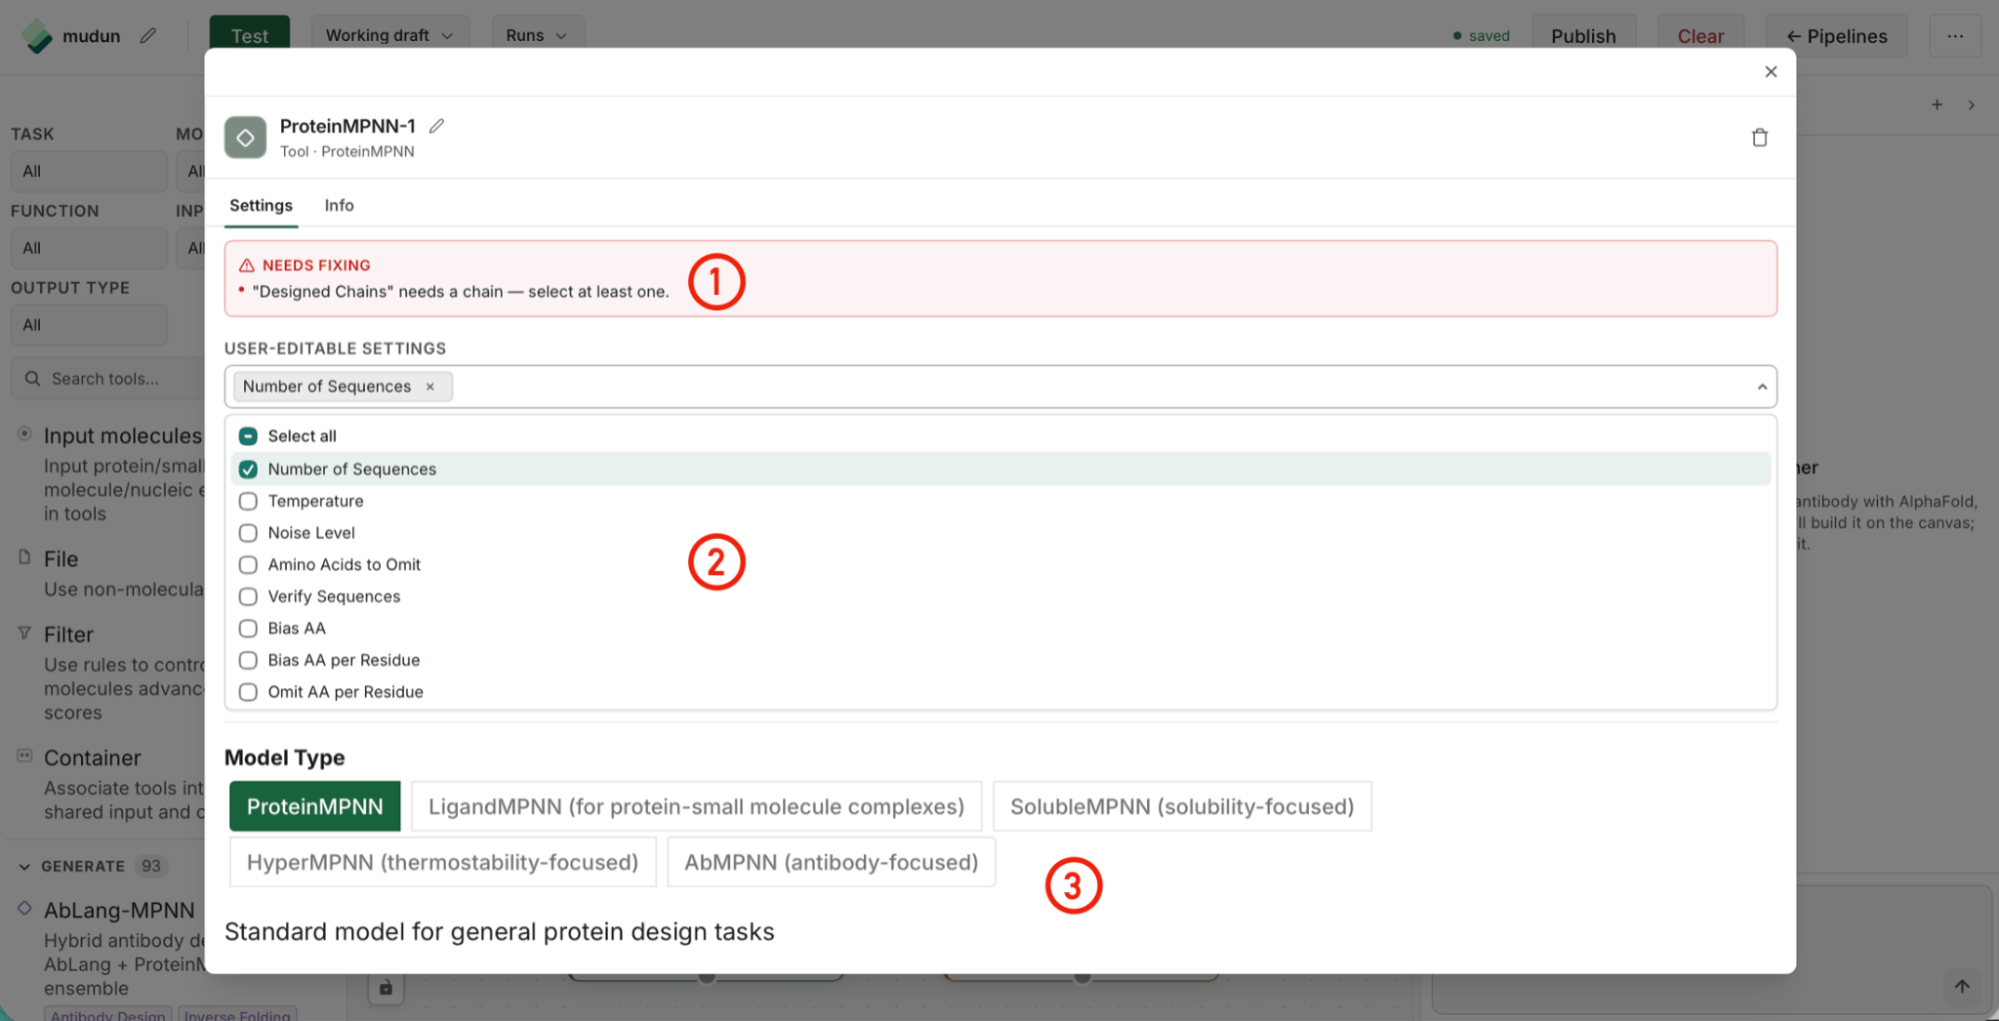
- The node interface shows what needs fixing
- Select what settings the users can edit for each tool when running the pipeline
- Go on to define the behind-the-scenes settings for the tool
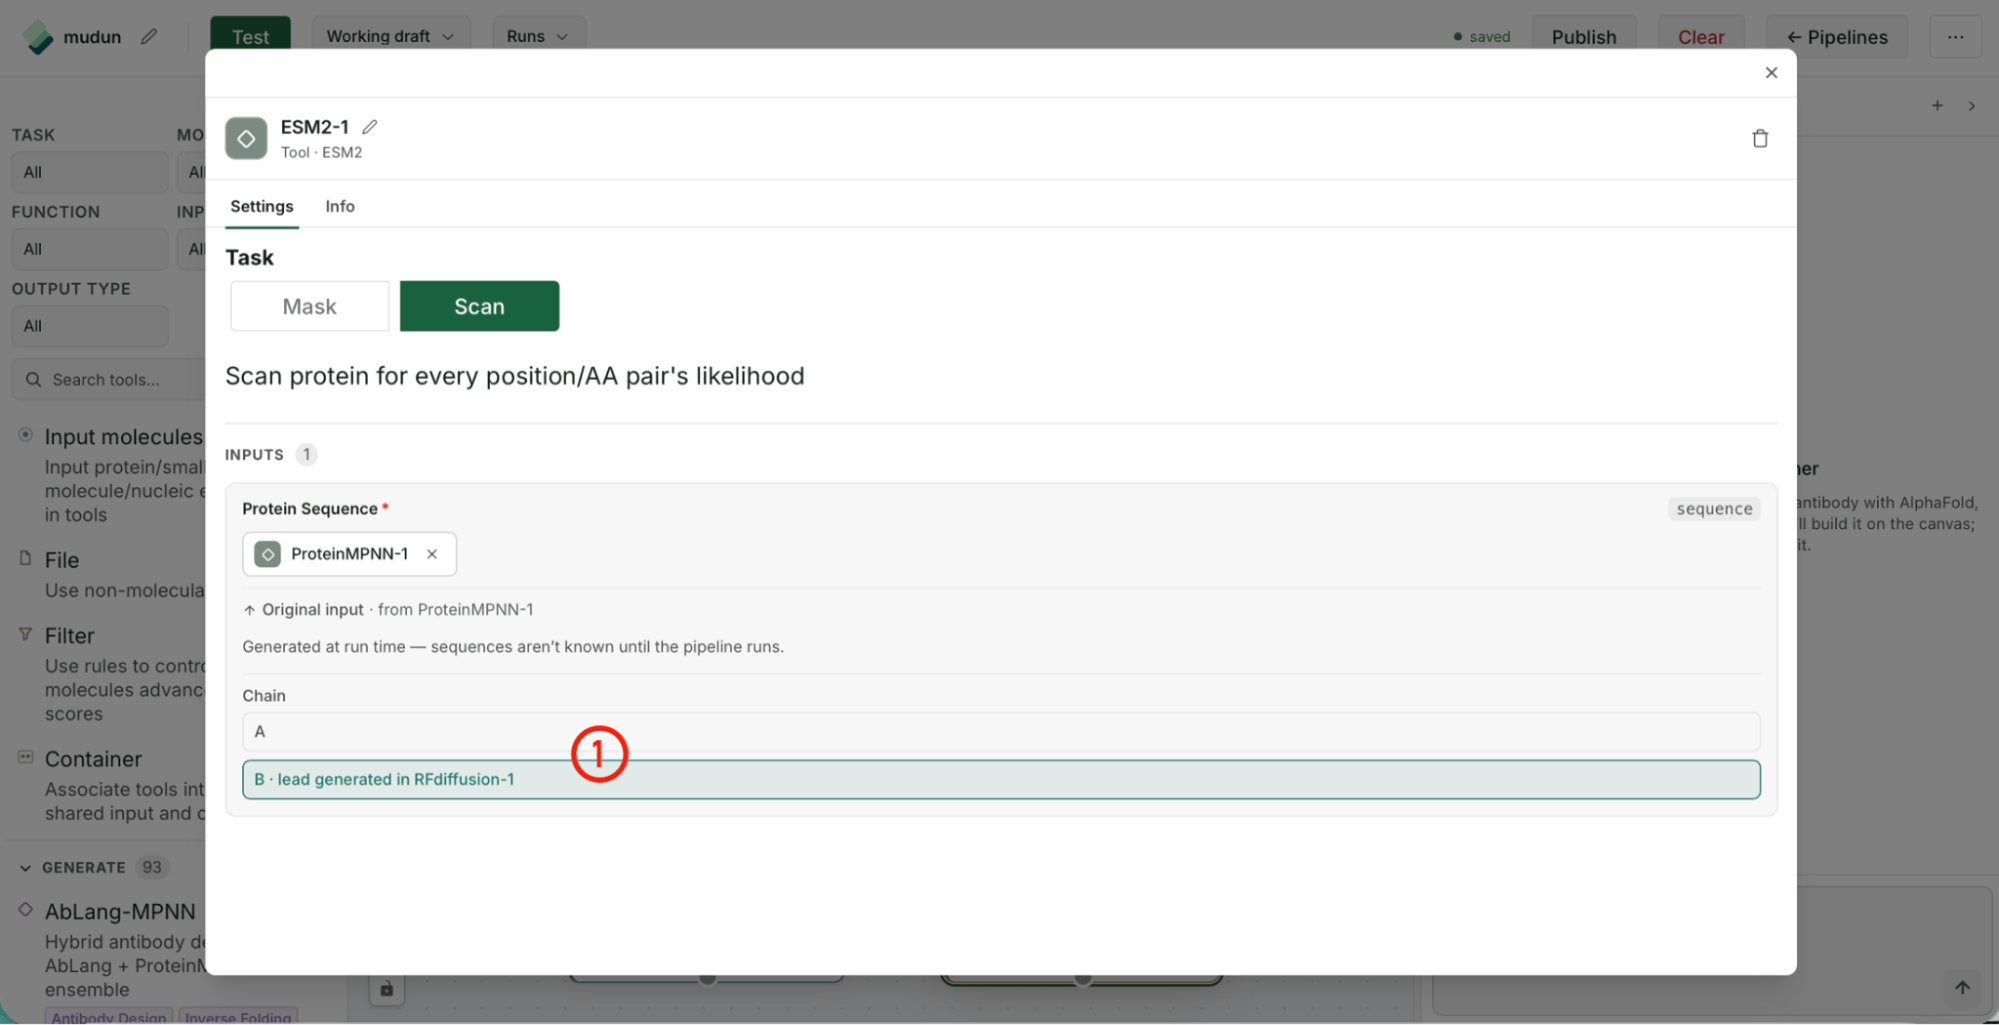
- Some tools will require selecting certain chain outputs
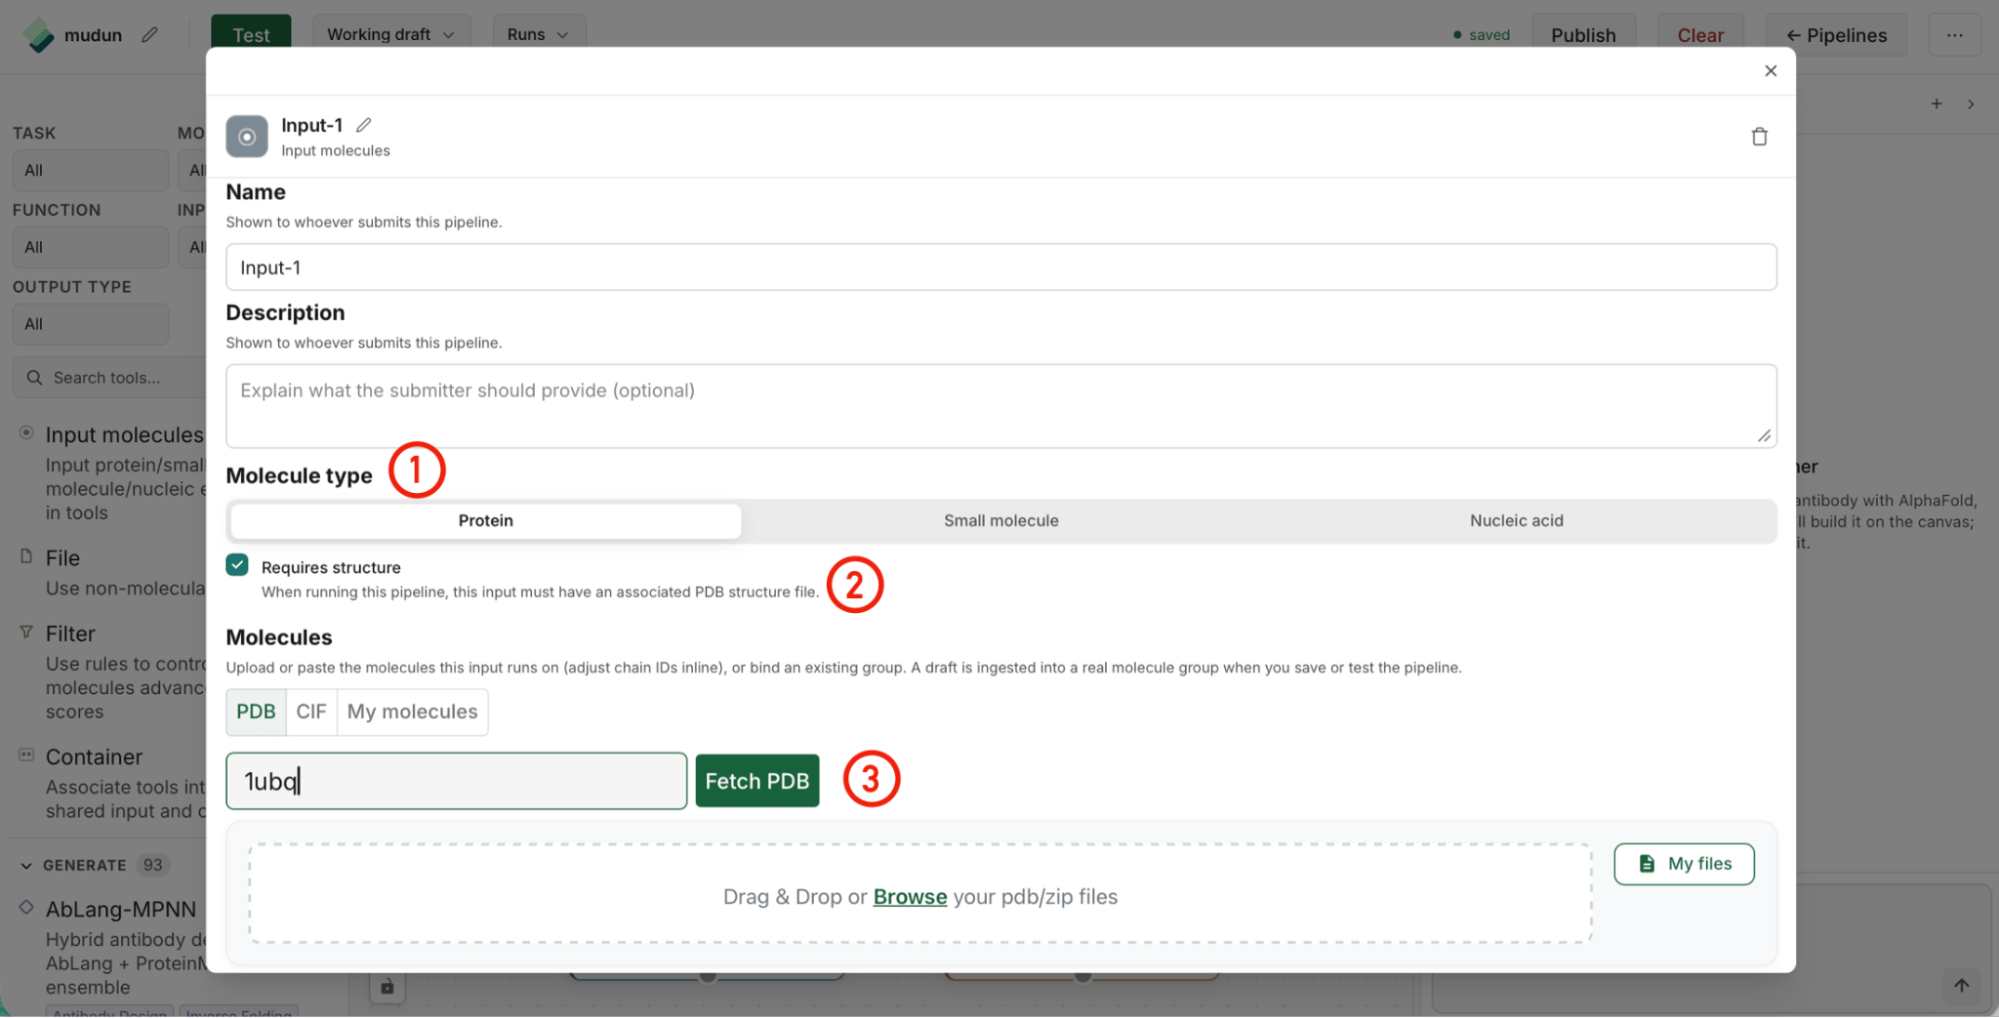
- For input nodes, select molecule type
- Determine whether downstream nodes require structure or just sequence
- Add a default molecule like you would in any other Tamarind tool
Running a pipeline
Test runs let you validate the whole graph against your default molecule before you commit. Once it looks right, publish the pipeline so others in your organization can run it against their own inputs, and track progress node-by-node from the run view.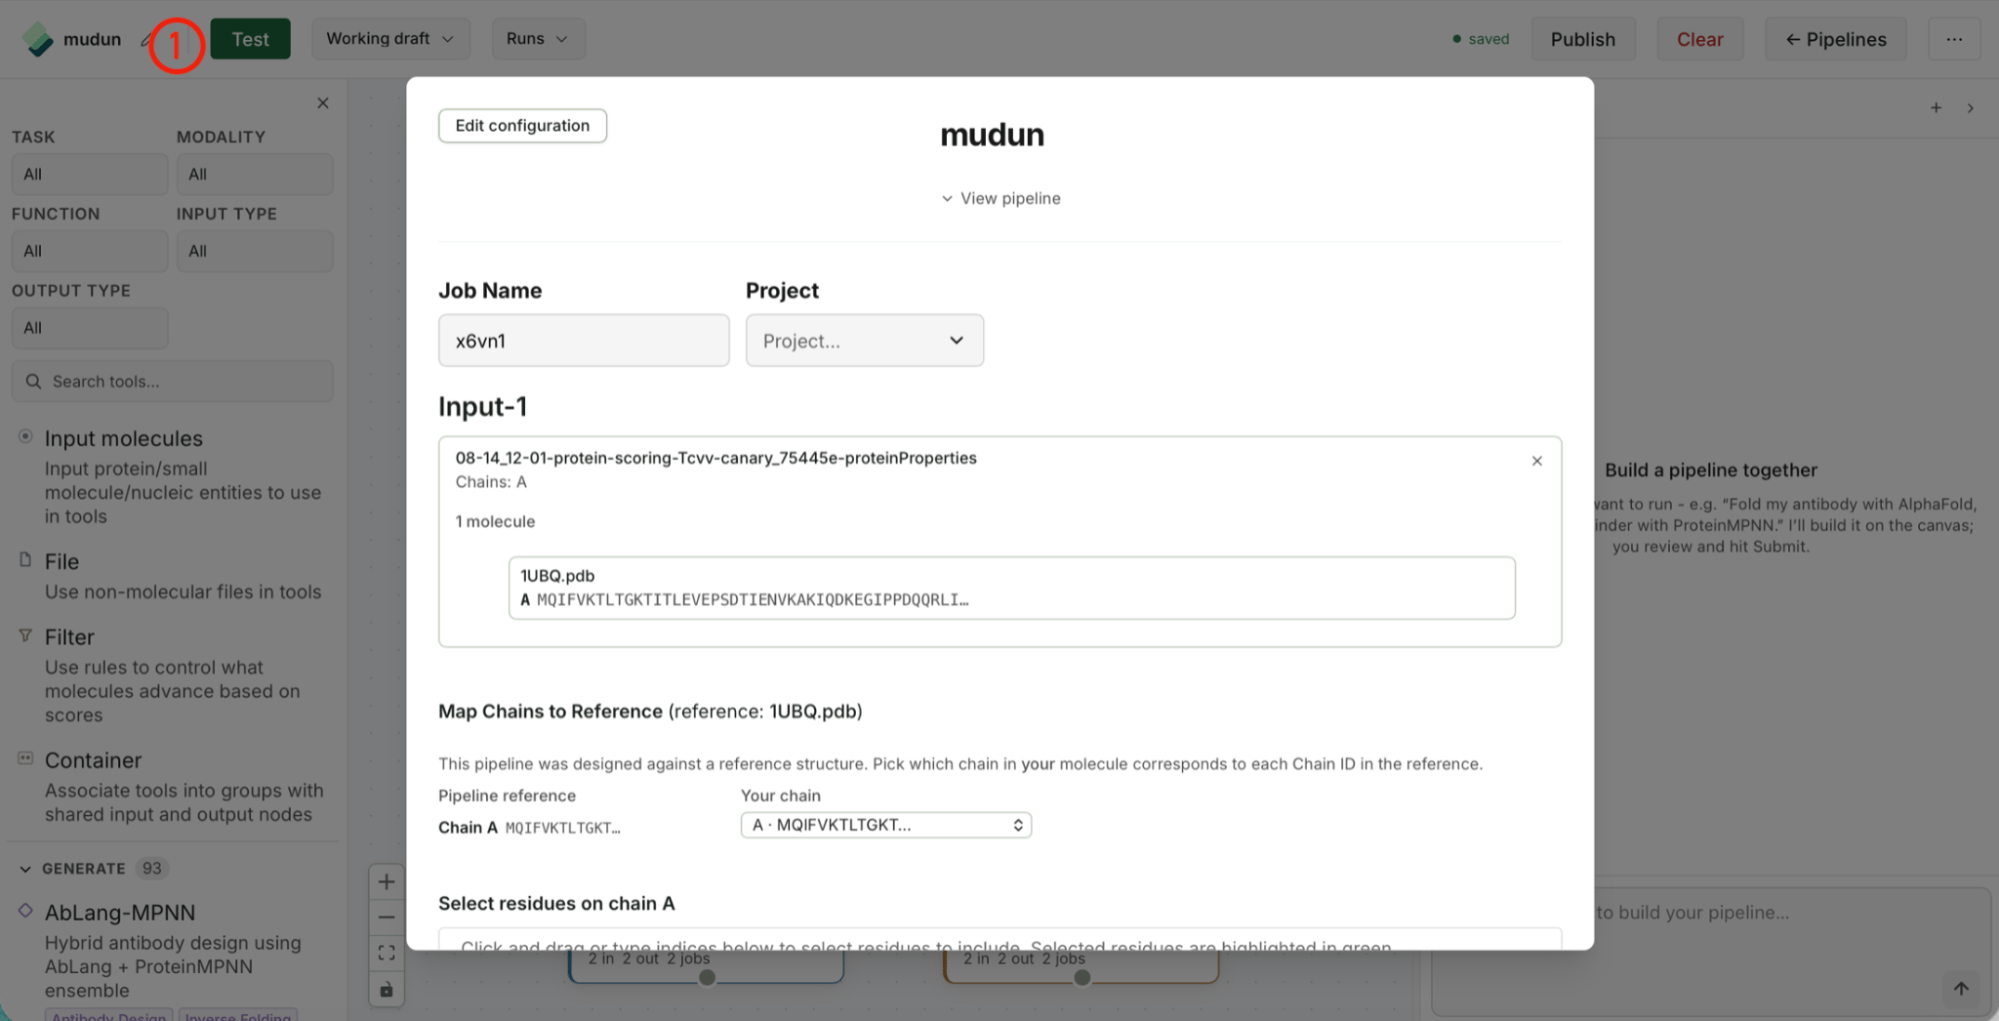
- Test run a pipeline to ensure everything works properly with the Test button in the top left
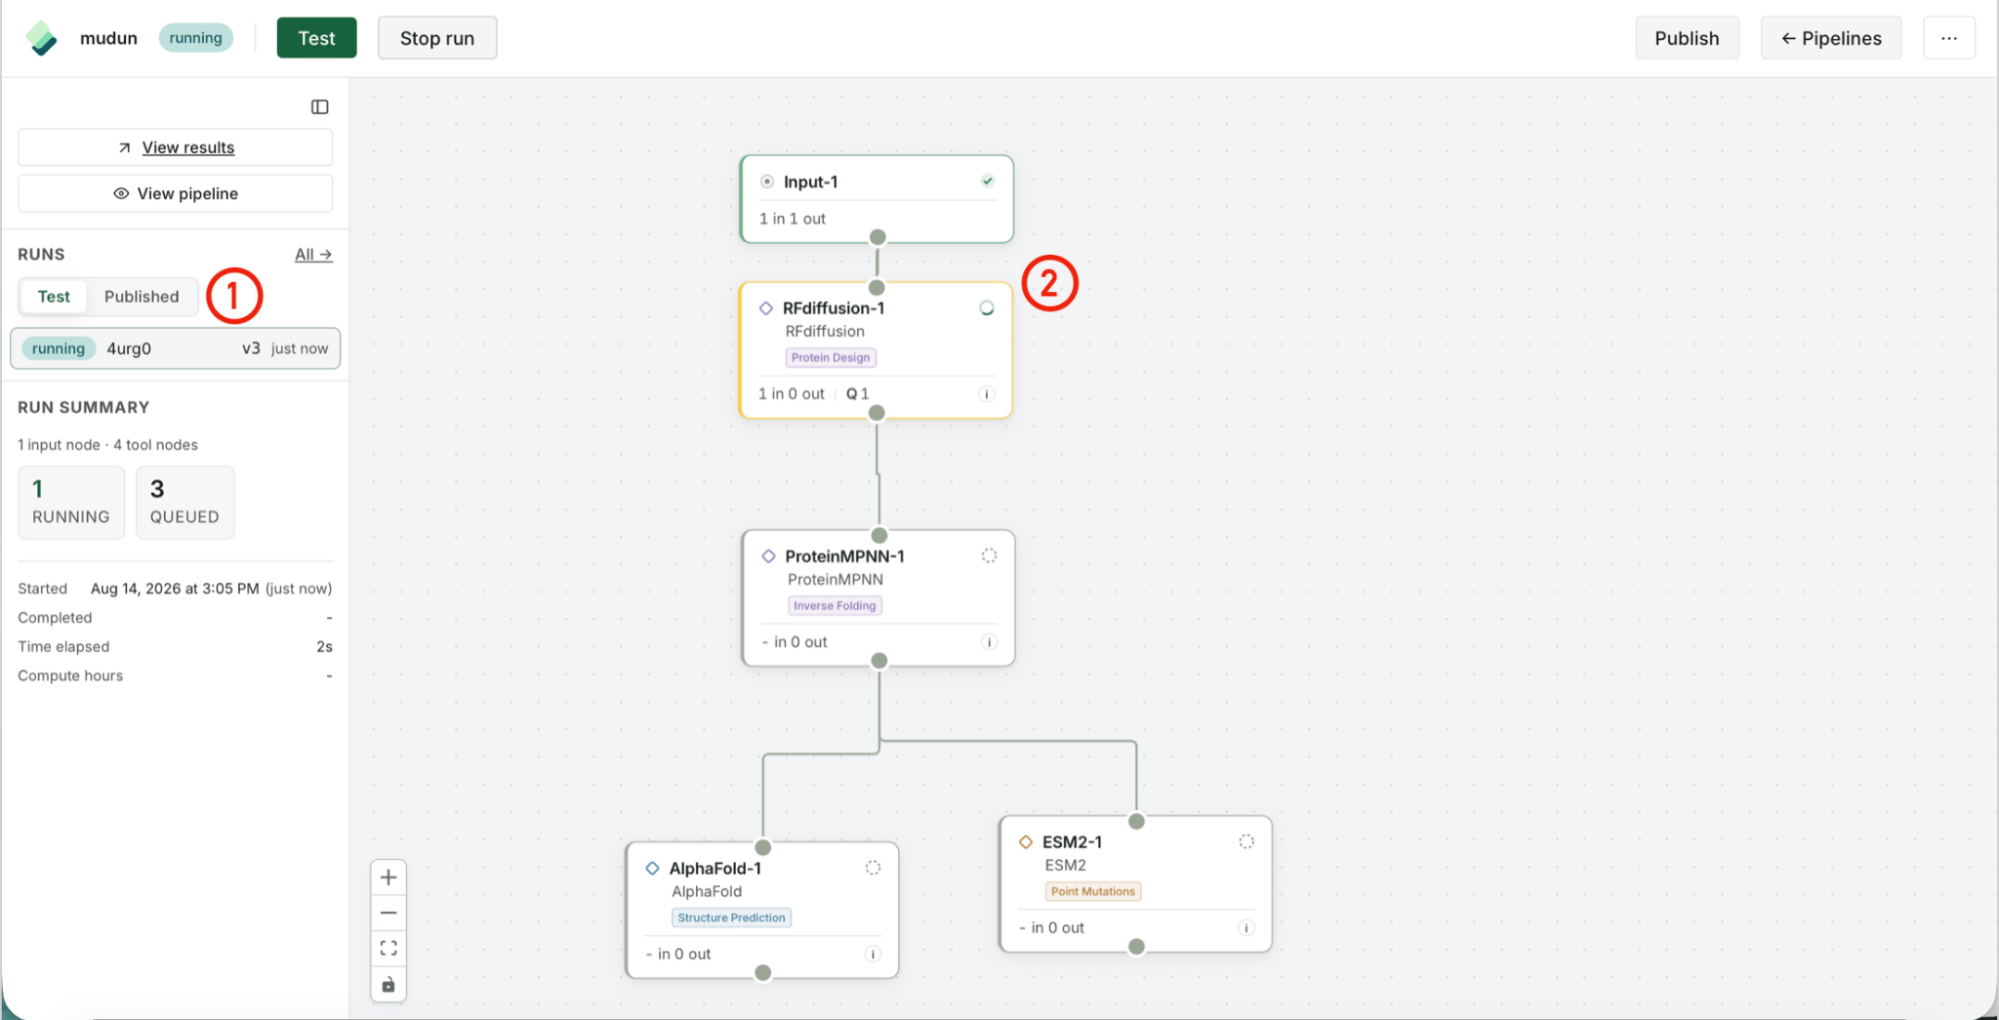
- View your test or published runs, or view/modify the pipeline to create a new version
- See how each node is progressing, or if there are runtime issues with any node
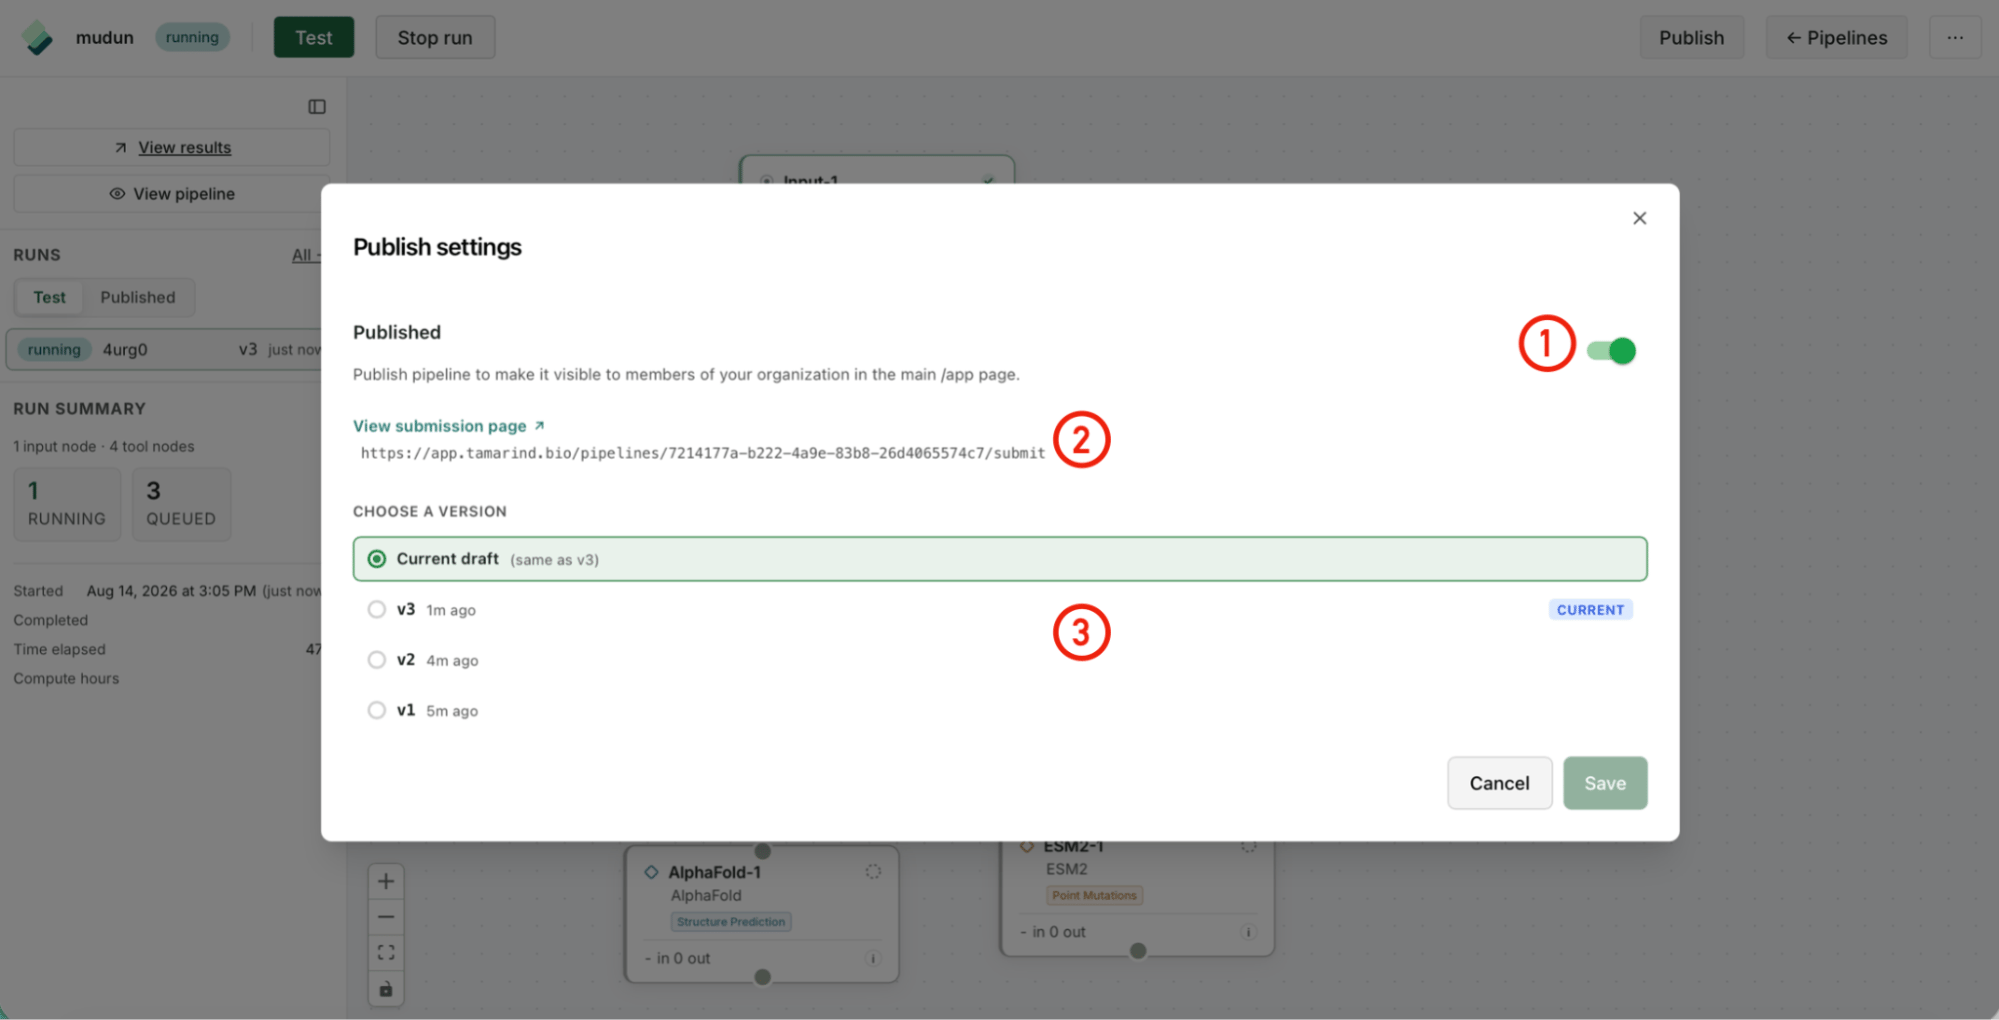
- Select the publish button in the top left to publish the pipeline for others in your organization to use
- The link will take you to your published pipeline, which also shows up in your Tools page on the pipelines tab as well
- You can select which pipeline version to publish