Experimental Validation
The following are binding rates assessed by SPR across antigens for IgDesign on HCDR3 and HCDR123, compared to SAbDab baseline with the native HCDR1 and HCDR2, and sampled HCDR3. 1437 antibodies were screened across 8 targets, and 278 binders were identified.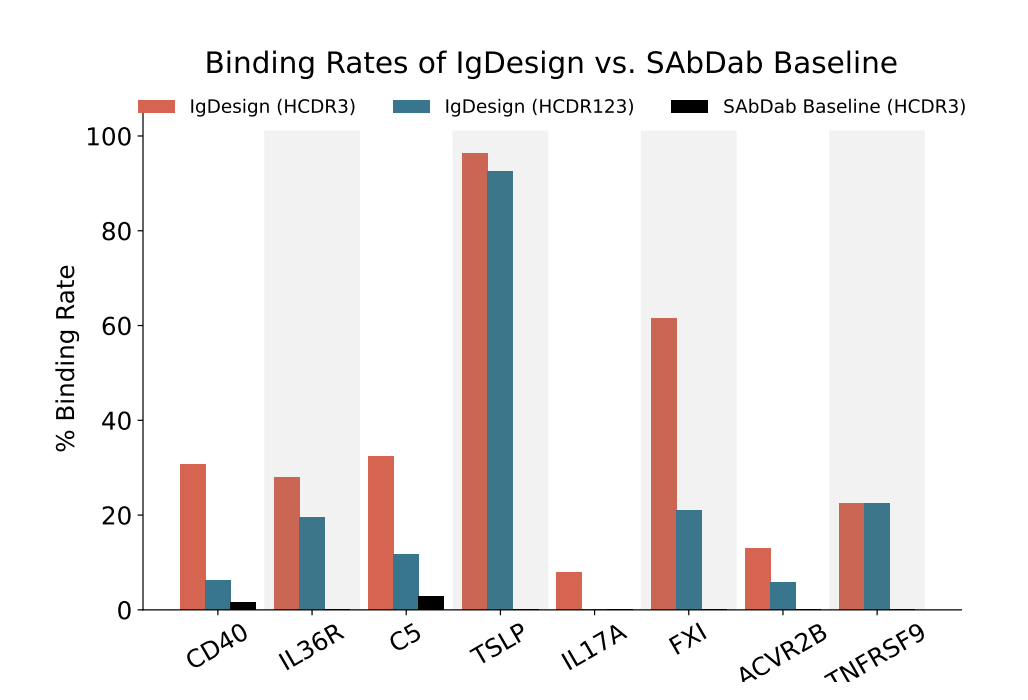
Inputs
- PDB File: Antibody-antigen complex structure in PDB format
- Heavy Chain ID
- Light Chain ID
- Antigen Chain ID
- Number of Batches: Number of batches to process, where each batches will generate 1000 sequences (recommended: 1000 batches)
- Verify Sequences: This will automatically submit your output sequences to a structure predicton tool for verification
- Select Custom CDR Indices: Optionally, select indices to design for each CDR instead of detecting them (IMGT numbered CDRs used by default)
Outputs
- Redesigned CDRs: A list of redesigned CDRs
- CE Loss Scores: Cross-entropy loss scores for each design, used to rank the designs (lower is better)